2MOON Dashboard: Completed Trades: Options
Completed Trades
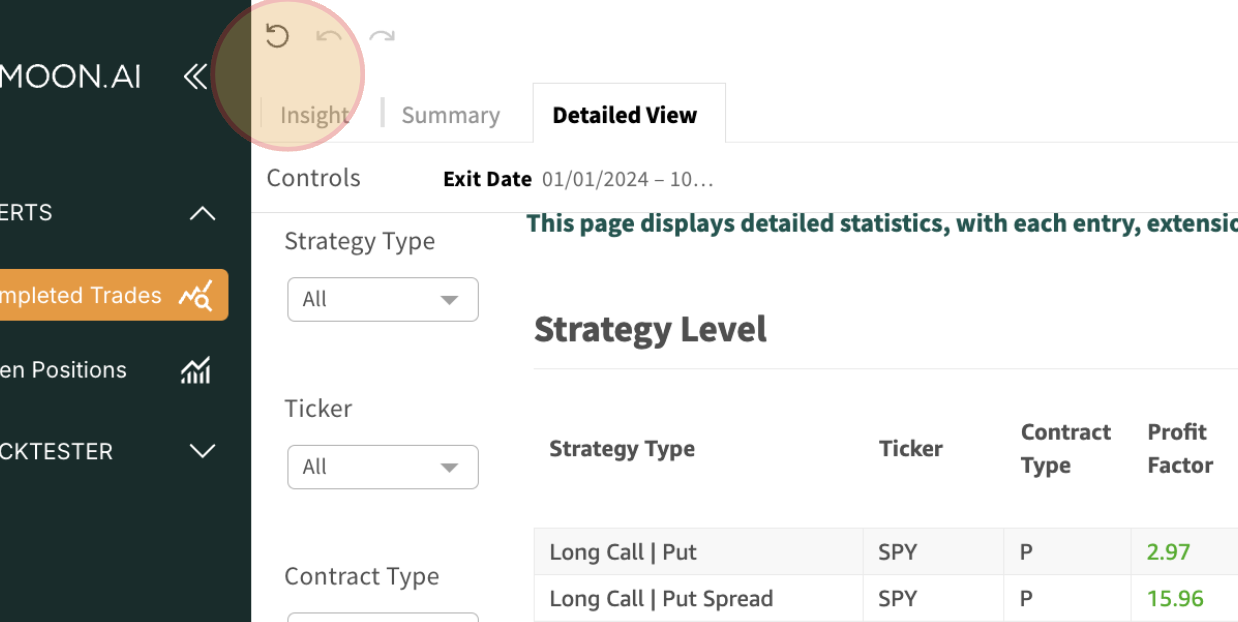
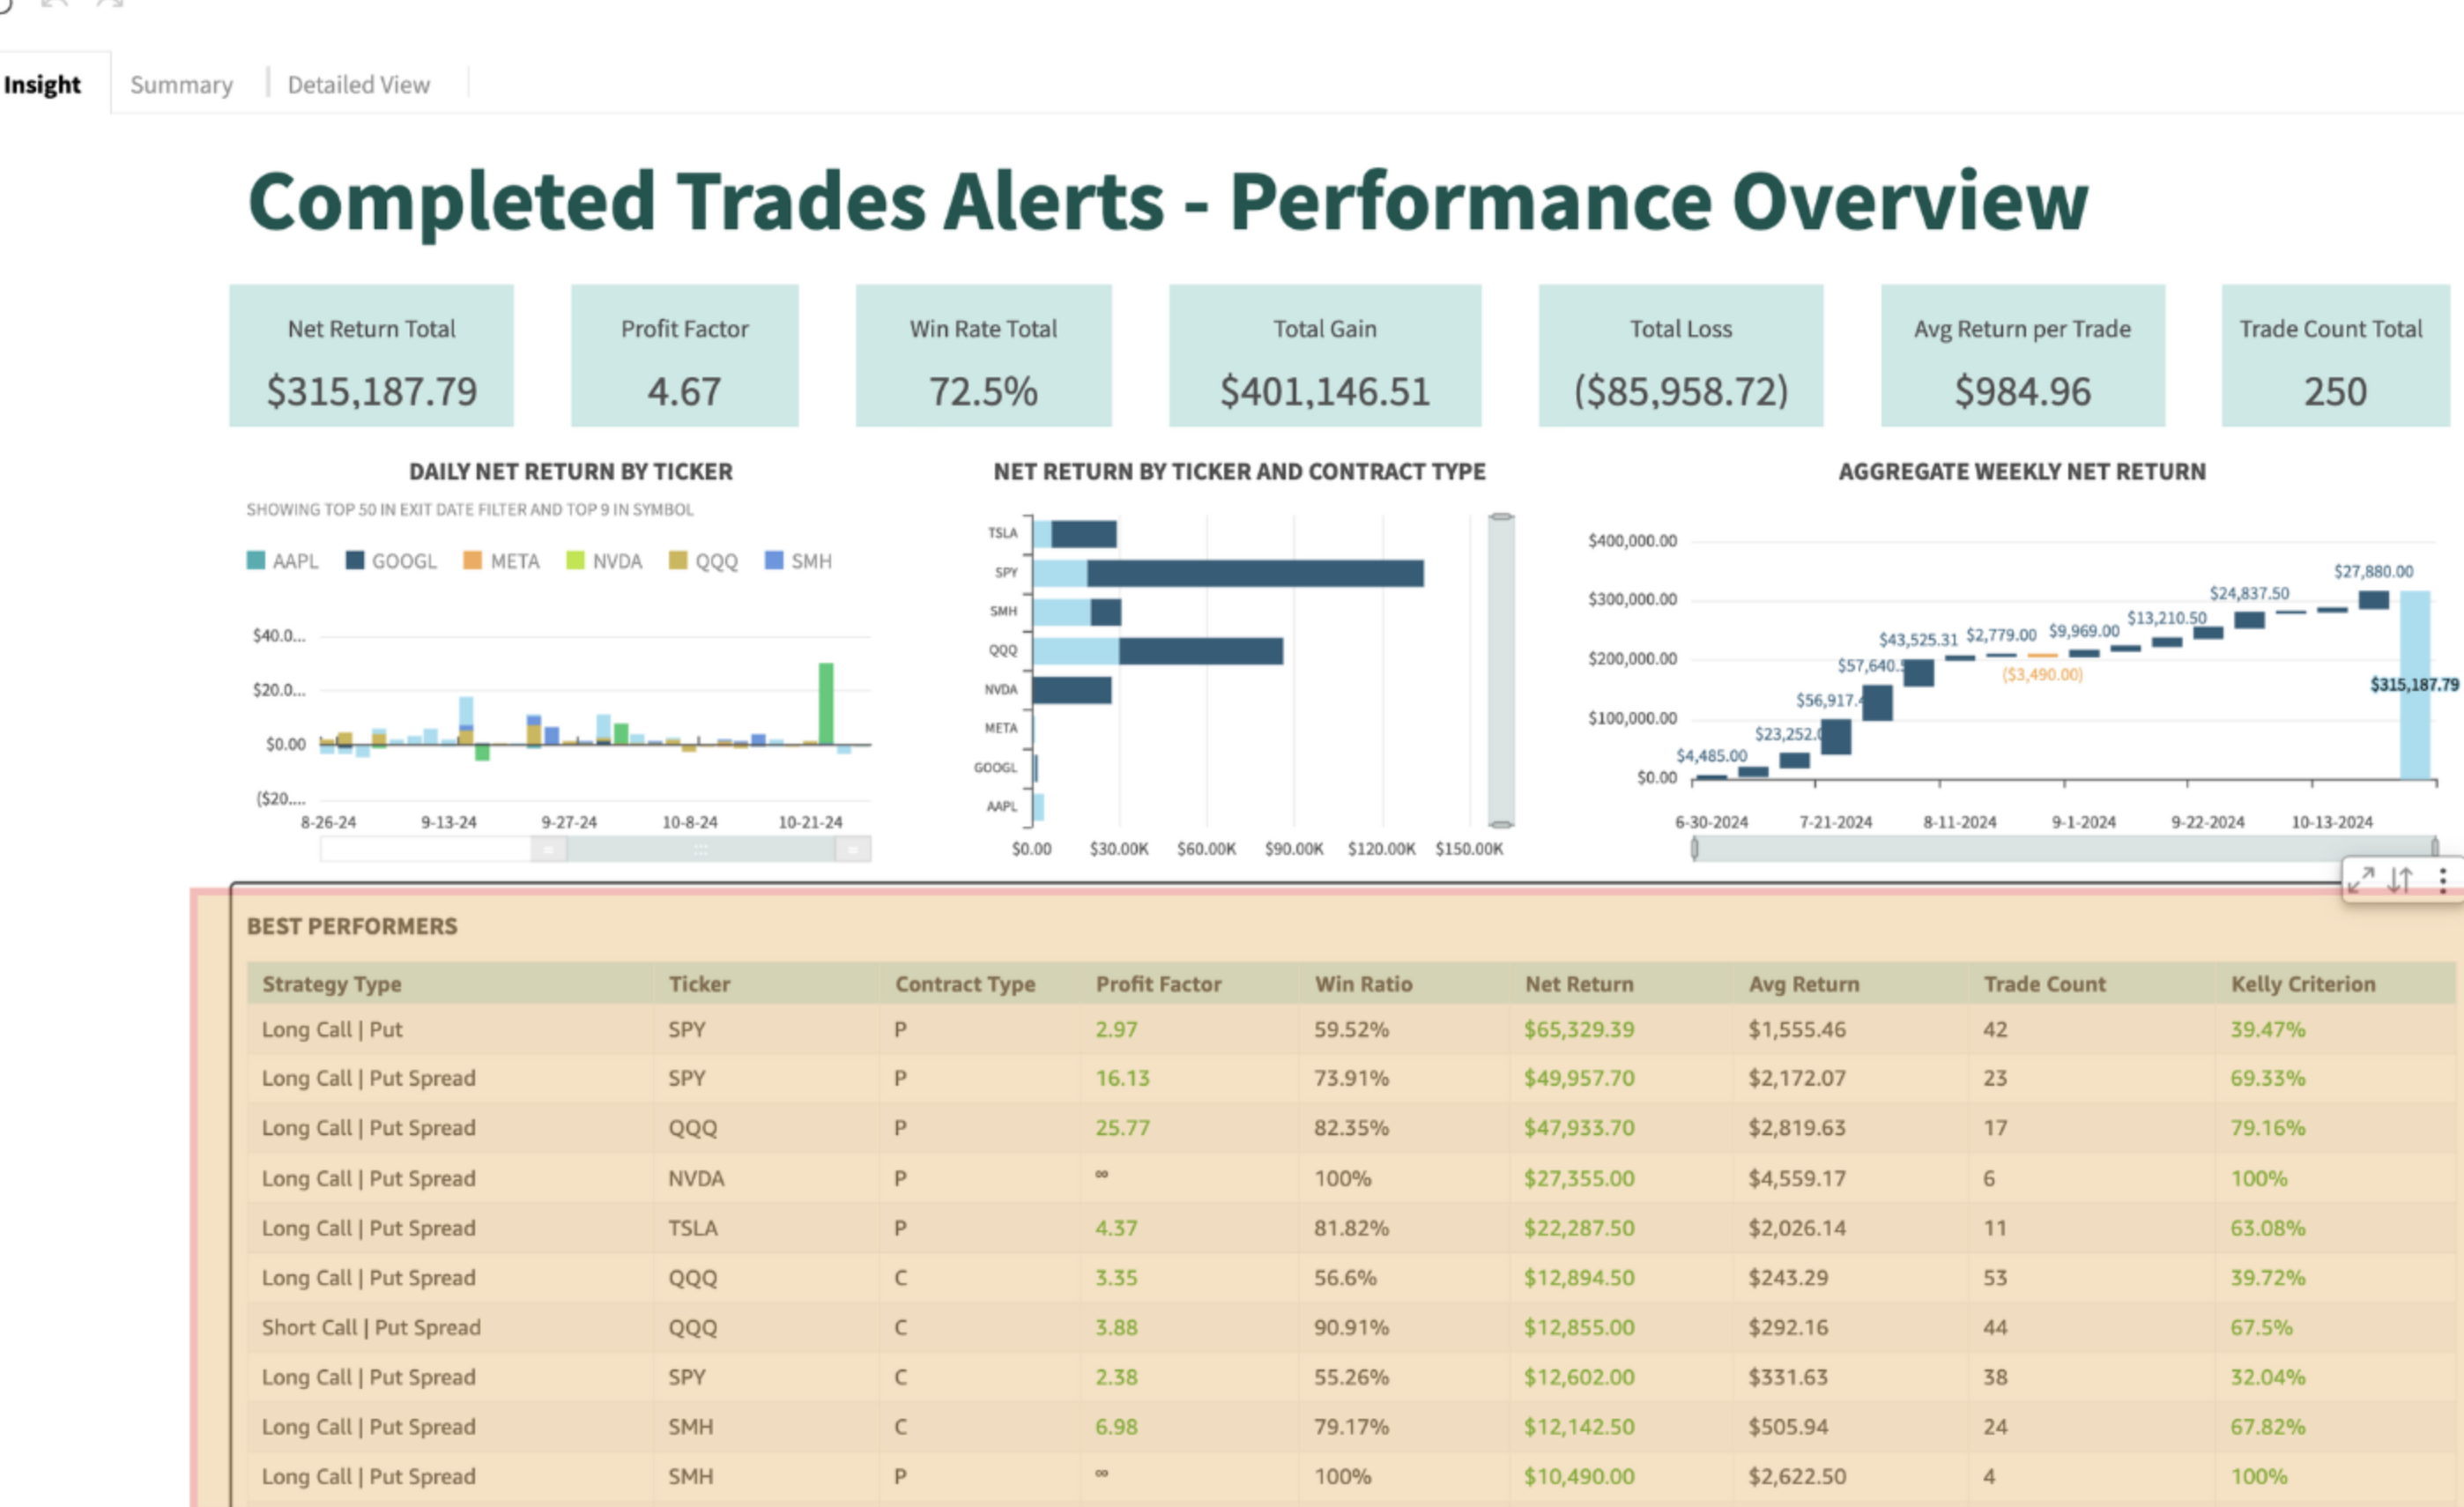
Insight Page
Insight Page gives you summary of your top performers
To access the Insight Page, click Alerts, Completed Trades
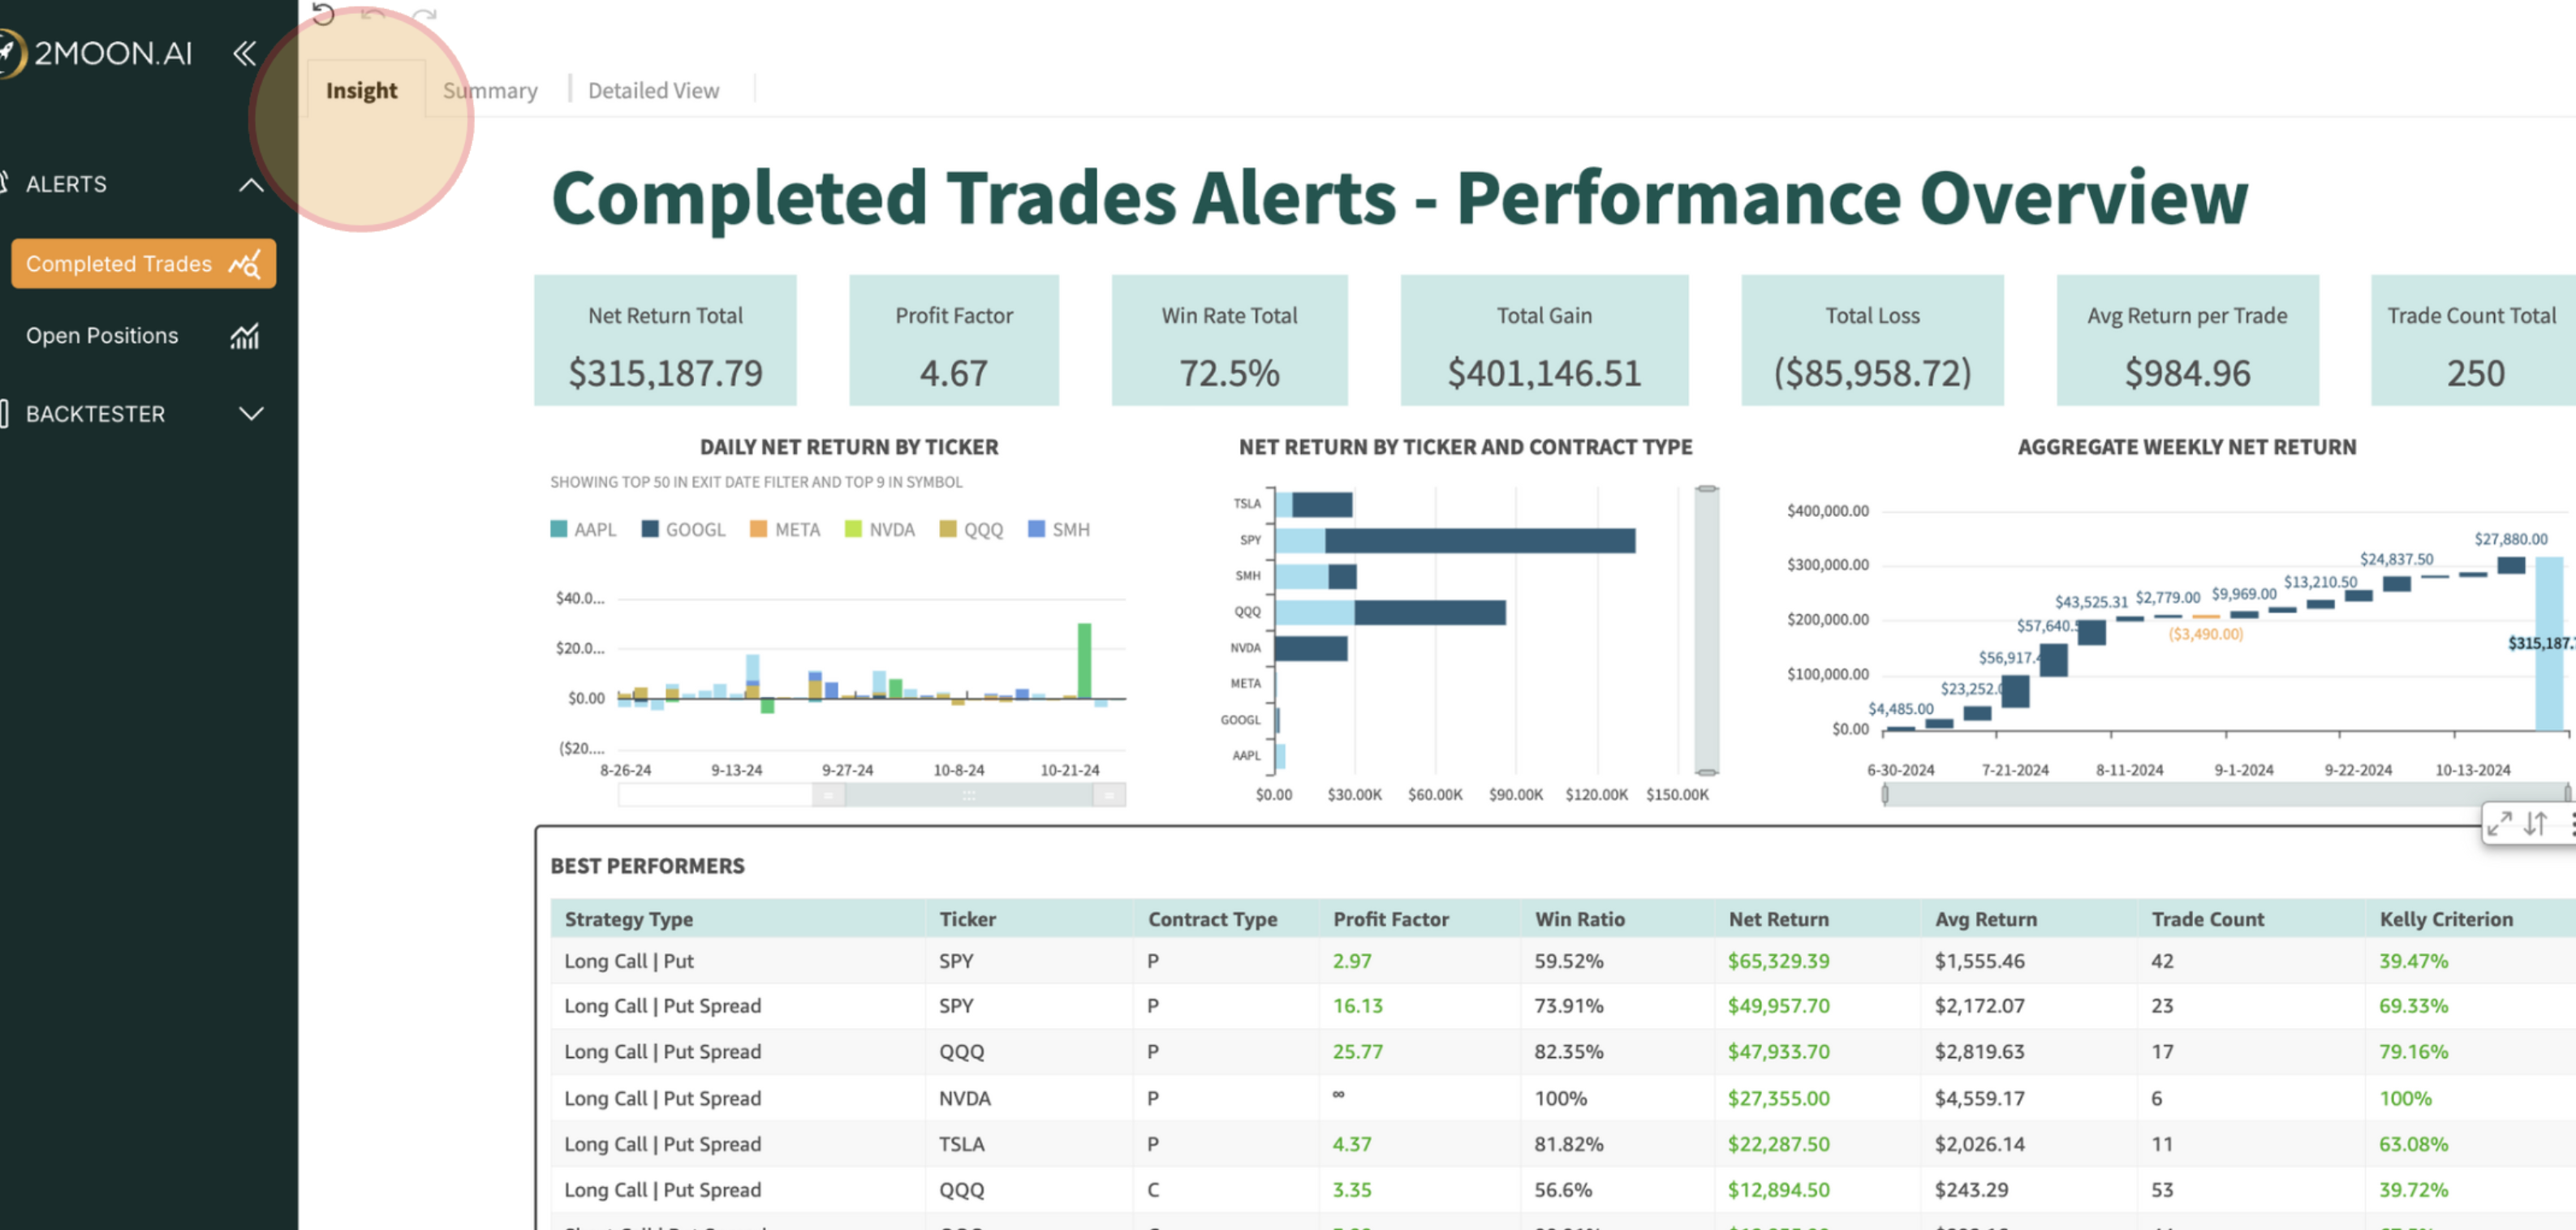
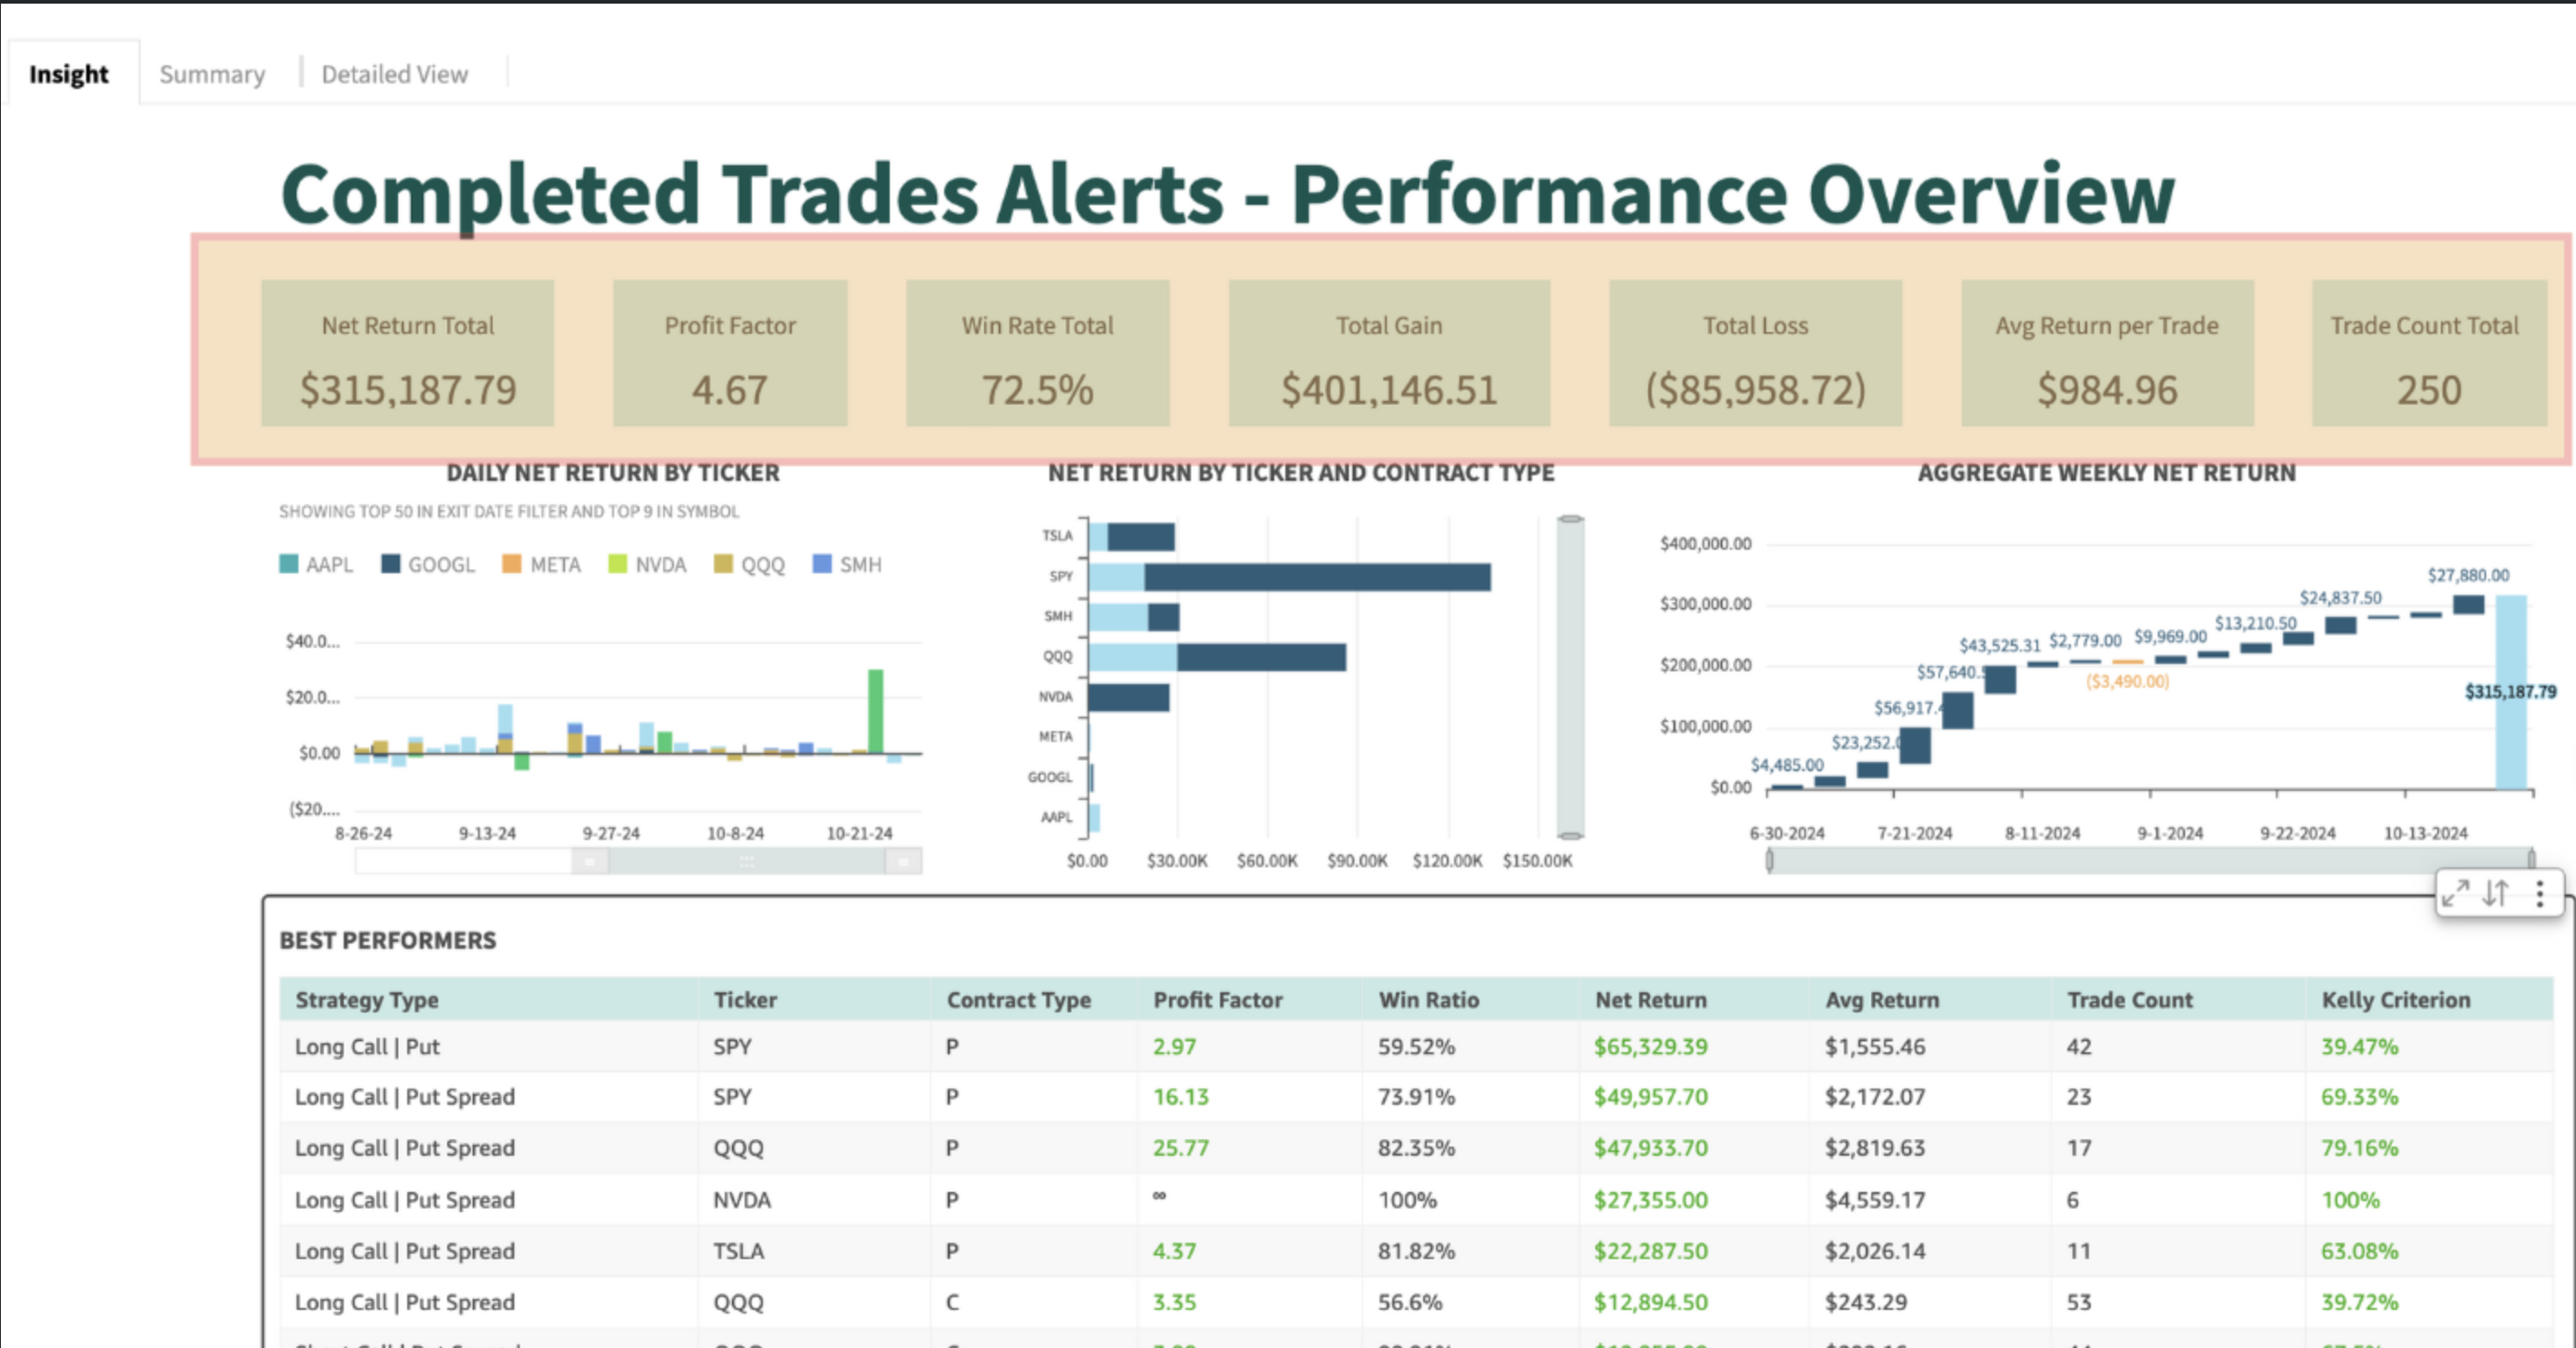
KPI
Key performance indicators will give you a clear view of how your trades have performed since you subscribed. These KPIs include: net return, profit factor, win ratio, total gain, Total loss, Average return and Total trade count
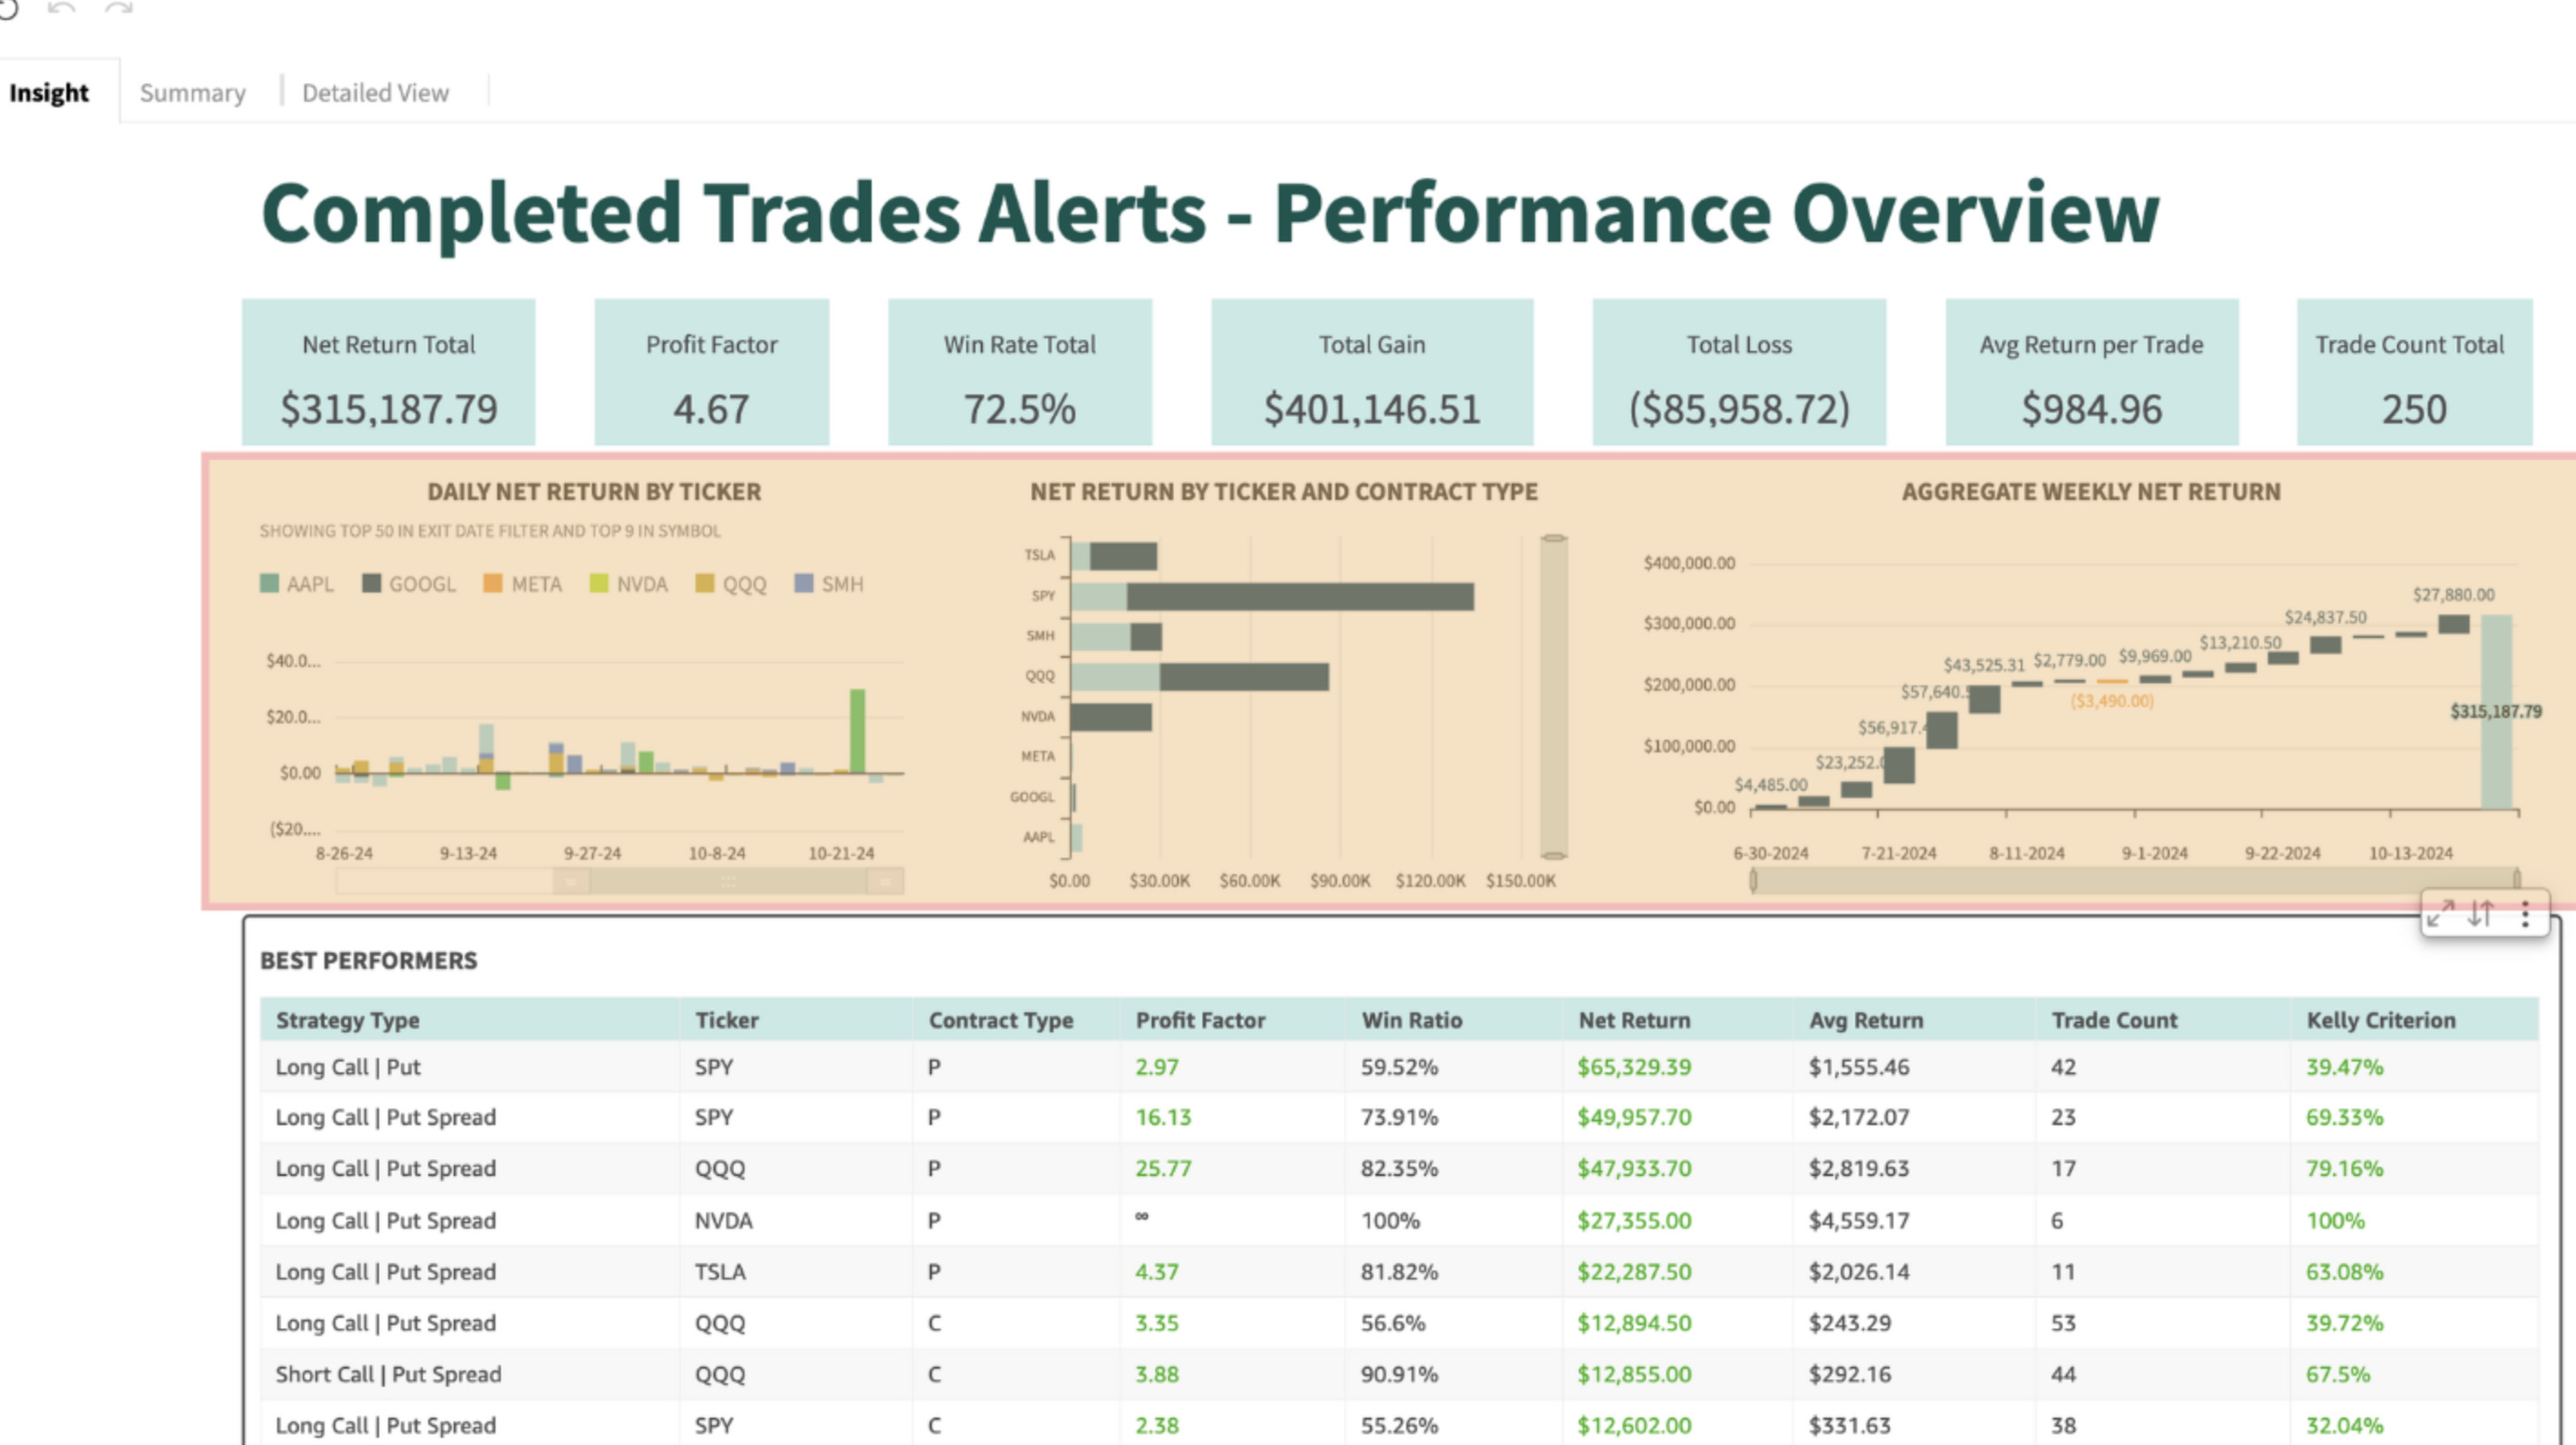
Graphs. Just below the KPIs, you'll find graphs that break down
your daily return by tickers,
net return by tickers and contract type
your account growth week by week
Best Performers is showcasing the strategies and tickers that delivered the best results.
Best Performers sheet grouped by Strategy type, tickers and contract type and shows KPIs such Profit Factor, Win Ratio, Net Return, Average Return, Trade Count, Kelly Criterion
Summary page/Detailed Summary
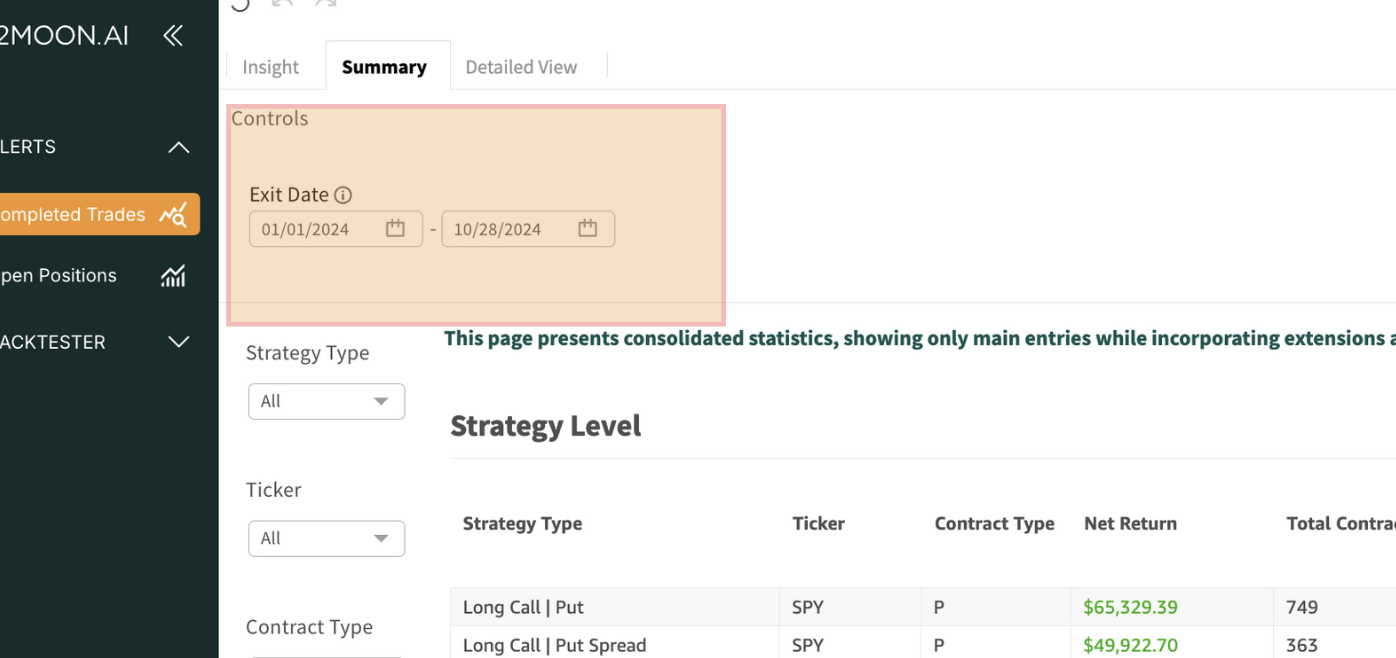
Summary Page gives you detailed information about trades you received alerts for and how they performed over time.
Summary - consolidated statistics, showing only main entries while incorporating extensions and reductions in all calculations
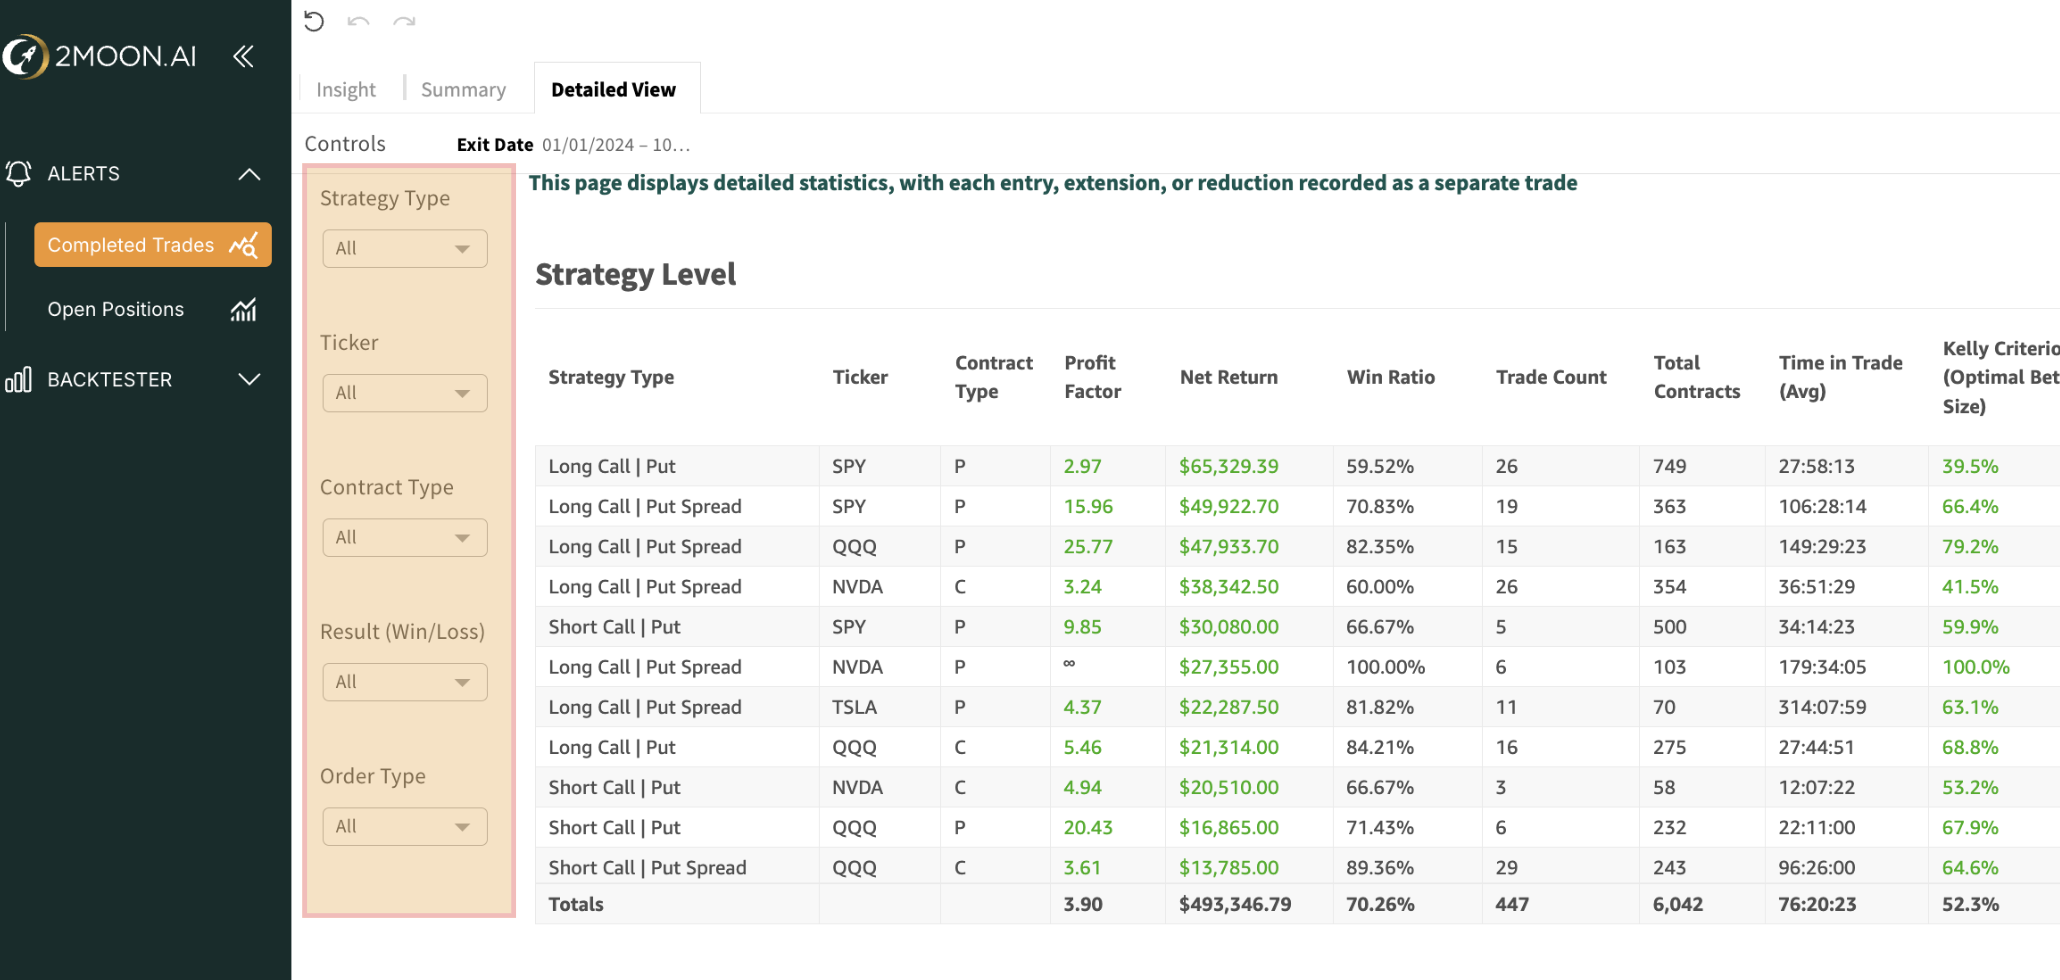
Detailed Summary detailed statistics, with each entry, extension, or reduction recorded as a separate trade
You will find two key sections: Strategy Level and Trade Level.
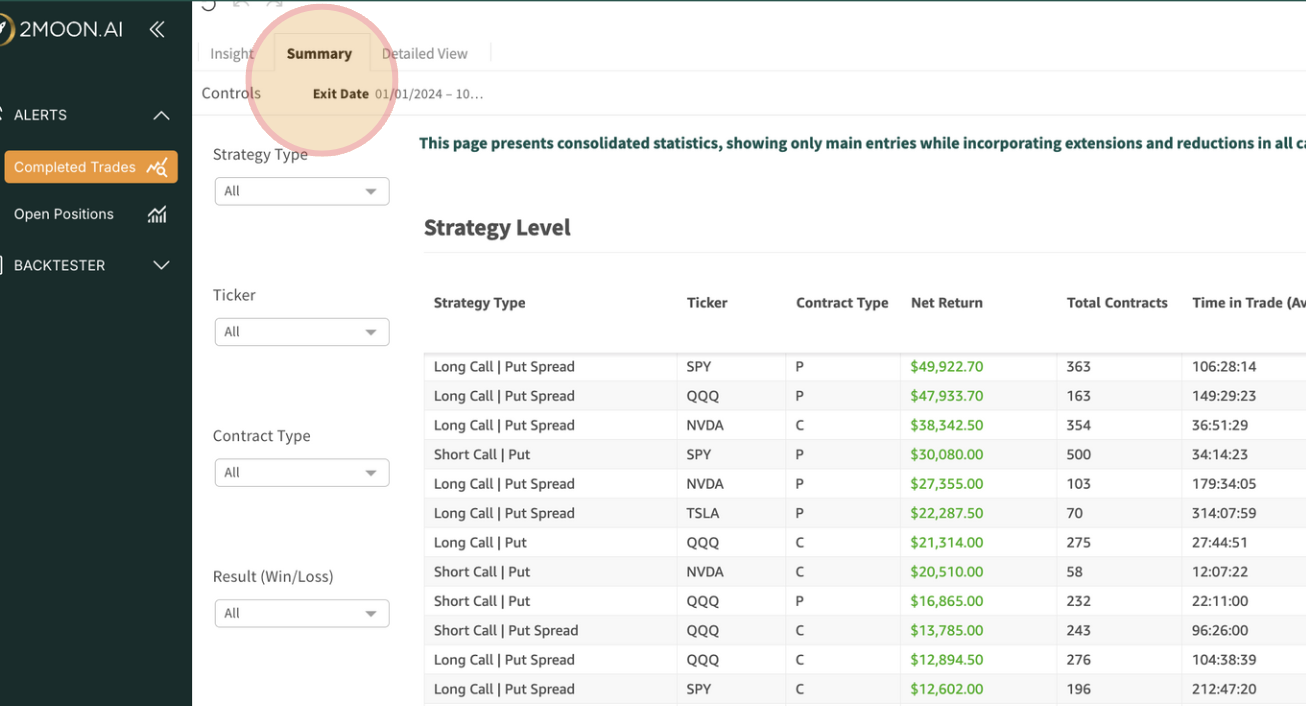
The Strategy Level gives you an overview of the total performance by strategy type and ticker, with KPIs like profit factor, net return, win ratio, and more.
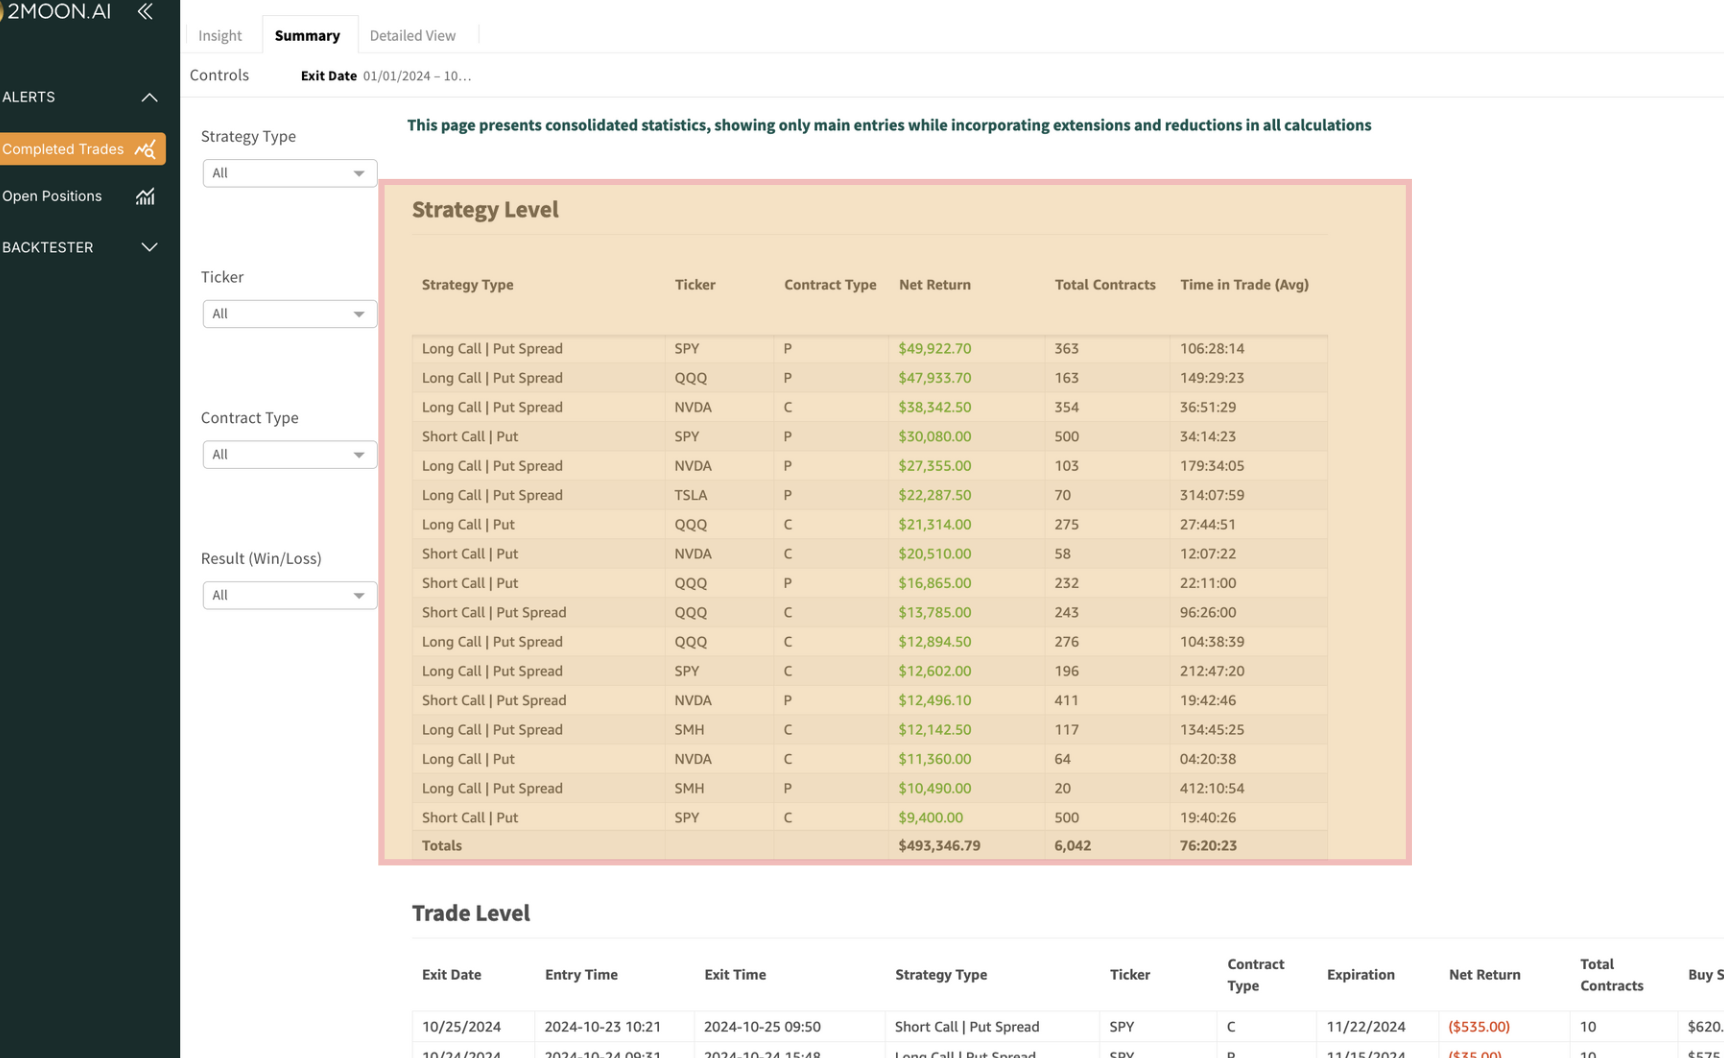
Bellow is the spreadsheet with KPIs/columns in the Strategy level and their definition
Strategy Level Column | Definition |
Strategy Type | Type of trading method:
|
Ticker | Symbol, such as SPY, QQQ, AAPL etc |
Contract Type | C - Call, P - Put |
Profit Factor | The profit factor is a ratio that measures the profitability of a trading system by comparing the total profit to the total loss |
Net Return | total profit or loss from of a trade |
Win Ratio | Win ratio is the percentage of winning trades out of the total number of trades |
Trade Count (Entry) | Trade count by Entry. For example, if a single trade has 3 partial closes, itis counted as 1 trade by Entry |
Trade Count | Trade Count by Exit. For example,if a single trade has 3 partial closes, itis counted as 3 trade by Exit |
Total Contracts | total number of option contracts (calls and puts) traded within a specific period. |
Time in Trade | duration a position is held from entry to exit in a trade |
Kelly Criterion | a formula used to determine the optimal size of a series of bets or trades to maximize long-term growth while minimizing risk |
Return (Avg) | the mean amount of profit or loss generated by an investment or trade over a specific period |
Winner (Avg) | refers to the mean profit earned from all winning trades within a given period |
Loser (Avg) | refers to the mean loss earned from all winning trades within a given period |
Biggest Winner | refers to the trade with the highest profit |
Biggest Loser | refers to the trade with the highest loss |
In the Trade Level, you’ll dive into detailed stats for every closed trade you received alerts for, complete with a variety of performance metrics
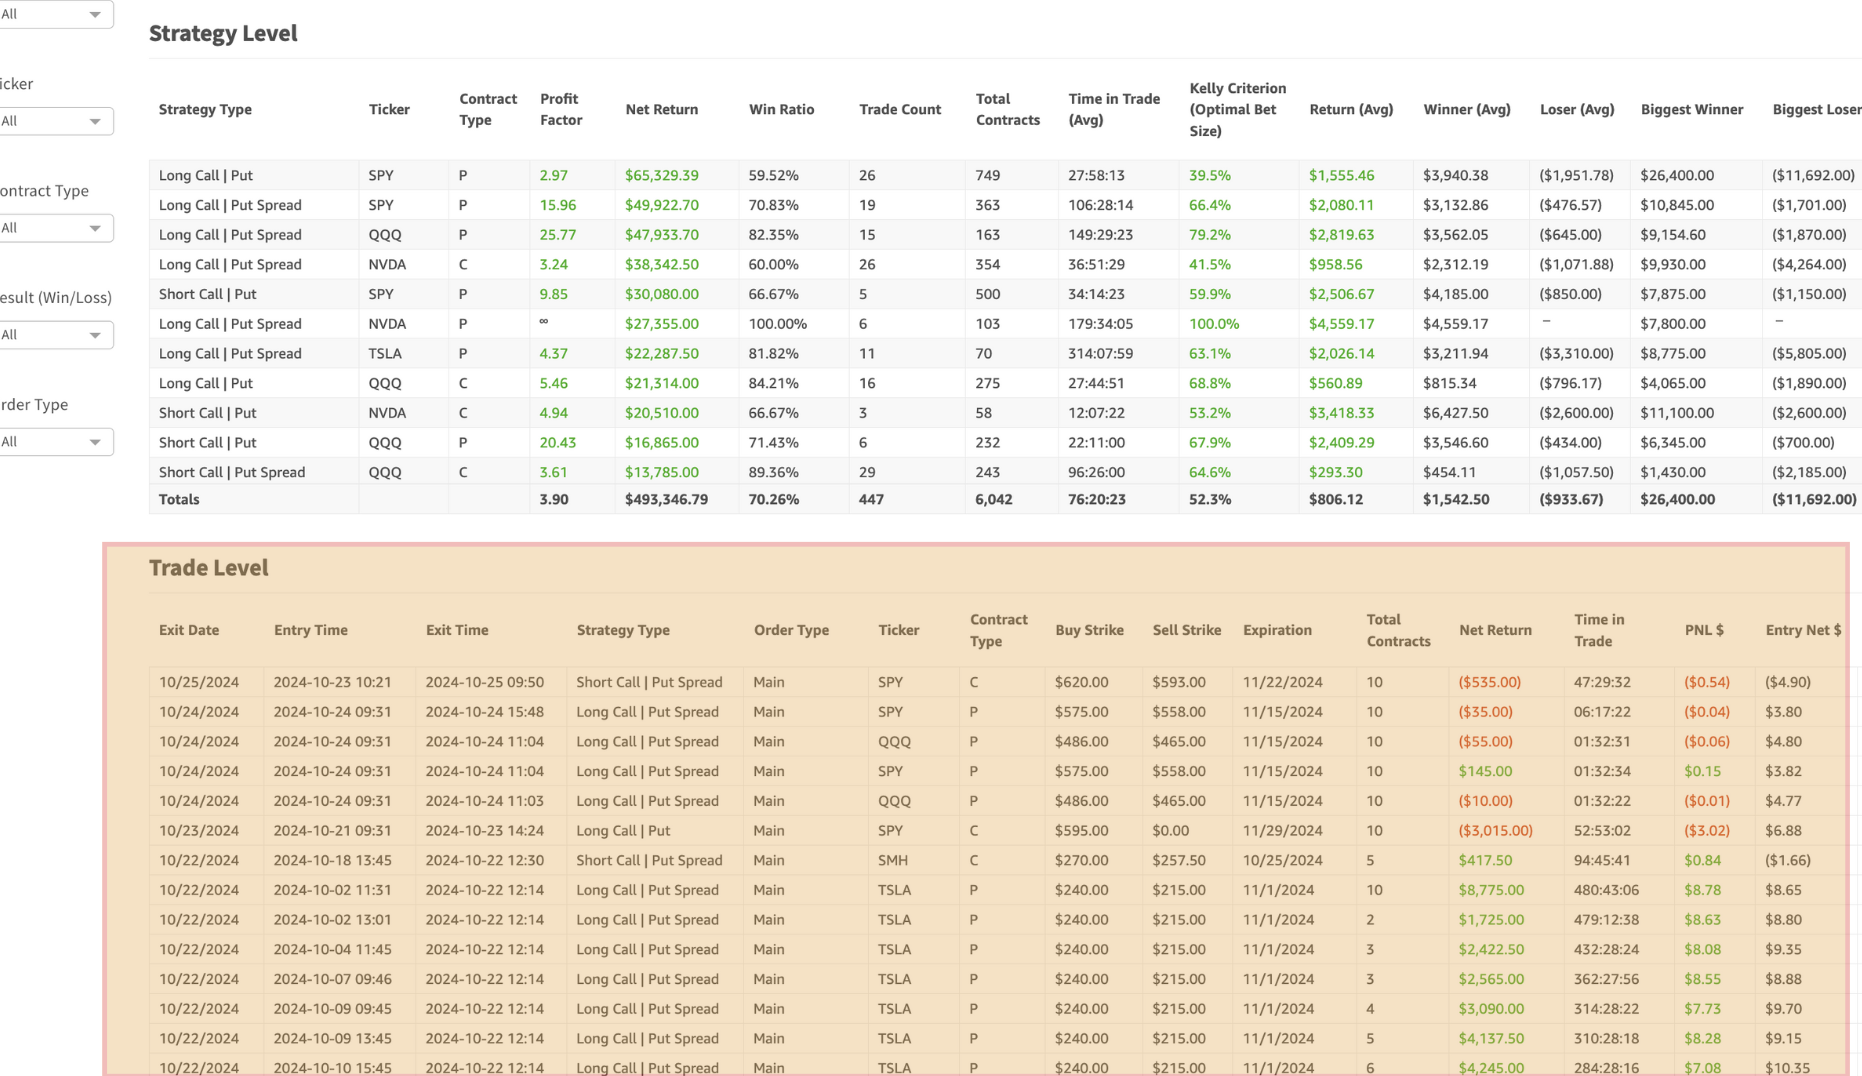
KPIs/columns in the Trade level and its definition
Strategy Level Columns | Definition |
Exit Date | refers to the date on which a trade is closed |
Entry Time | refers to the date & time on which a trade is opened |
Exit Time | refers to the date & time on which a trade is closed |
Strategy Type | Type of trading method:
|
Ticker | Symbol, such as SPY, QQQ, AAPL etc |
Contract Type | C - Call, P - Put |
Buy Strike | refers to the specific price at which the buyer of an options contract can exercise the right to buy (call) or sell (put) the underlying asset |
Sell Strike | refers to the specific price at which the buyer of an options contract can exercise the right to sell (call) or sell (put) the underlying asset |
Expiration | refers to the date when an options contract or other derivative reaches the end of its validity, after which it can no longer be exercised |
Qty | Quantity of option contracts |
Net Return | total profit or loss from of a trade |
Time in Trade | duration a position is held from entry to exit in a trade |
PnL | represents the financial outcome of a trade per option contract |
Entry Net $ | total price paid to enter an options trade, including premiums |
Exit Net $ | total price paid to exit an options trade, including premiums |
Entry Underlying | refers to the price of the asset (such as a stock or commodity) at the time an options trade is initiated |
Exit Underlying | refers to the price of the asset at the time an options trade is closed |
Trade UID | Unique trade ID |
Filters
Powerful 2MOON filters make analysis easier
Example: How to find Average time in trade for TSLA:
Filters on the left:
Strategy type
Long Call/Put
Long Call/Put spread
Short Call/Put spread
Ticker
Contract type
C - call
P - put
Result (Win/Loss)
Order type:
Main - main/first entry of a trade
Extension - add to a main position
Filters on the top:
Exit Date filter
Reset filters
To reset filters click on the top left corner