2MOON Dashboard: Completed Trades: Futures
Completed Trades
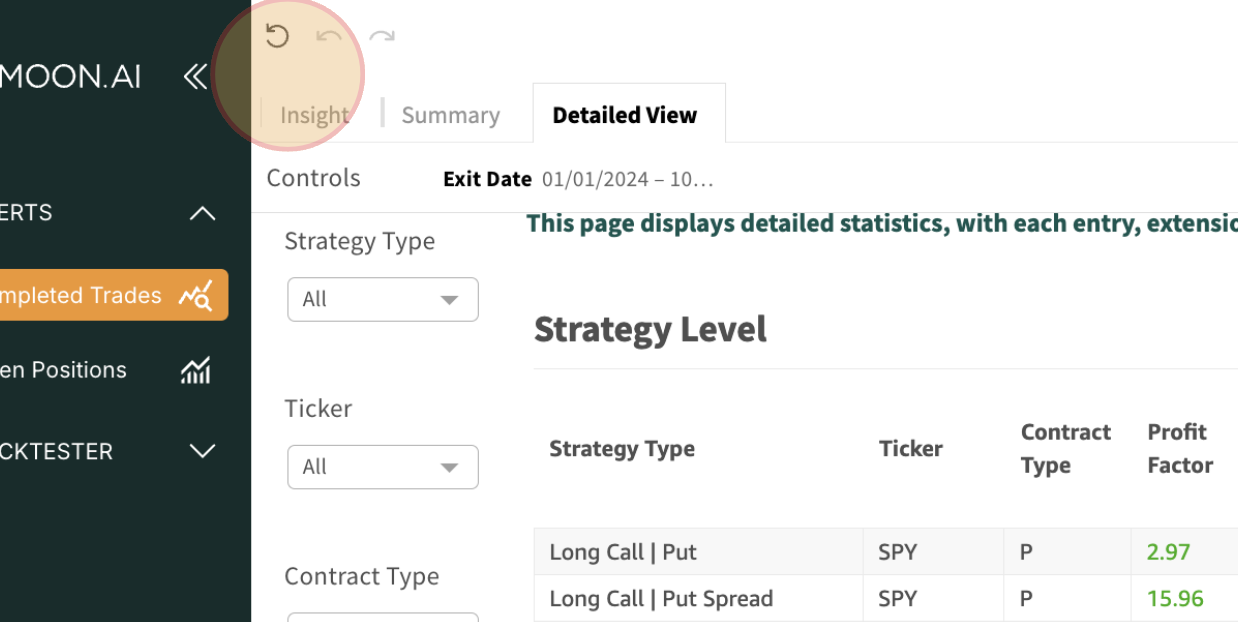
Detailed View Futures
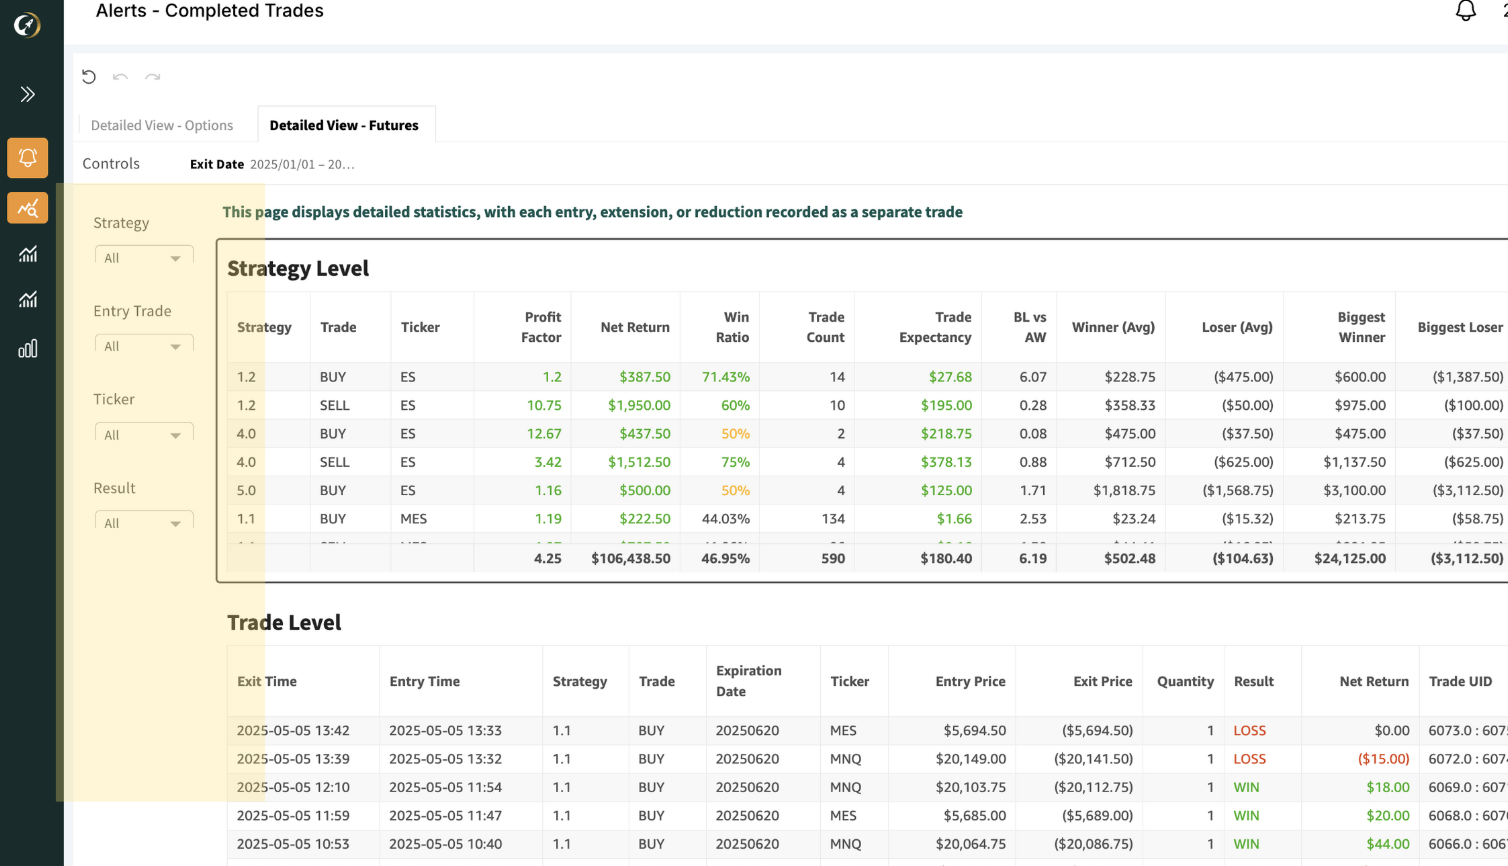
You will find two key sections: Strategy Level and Trade Level.
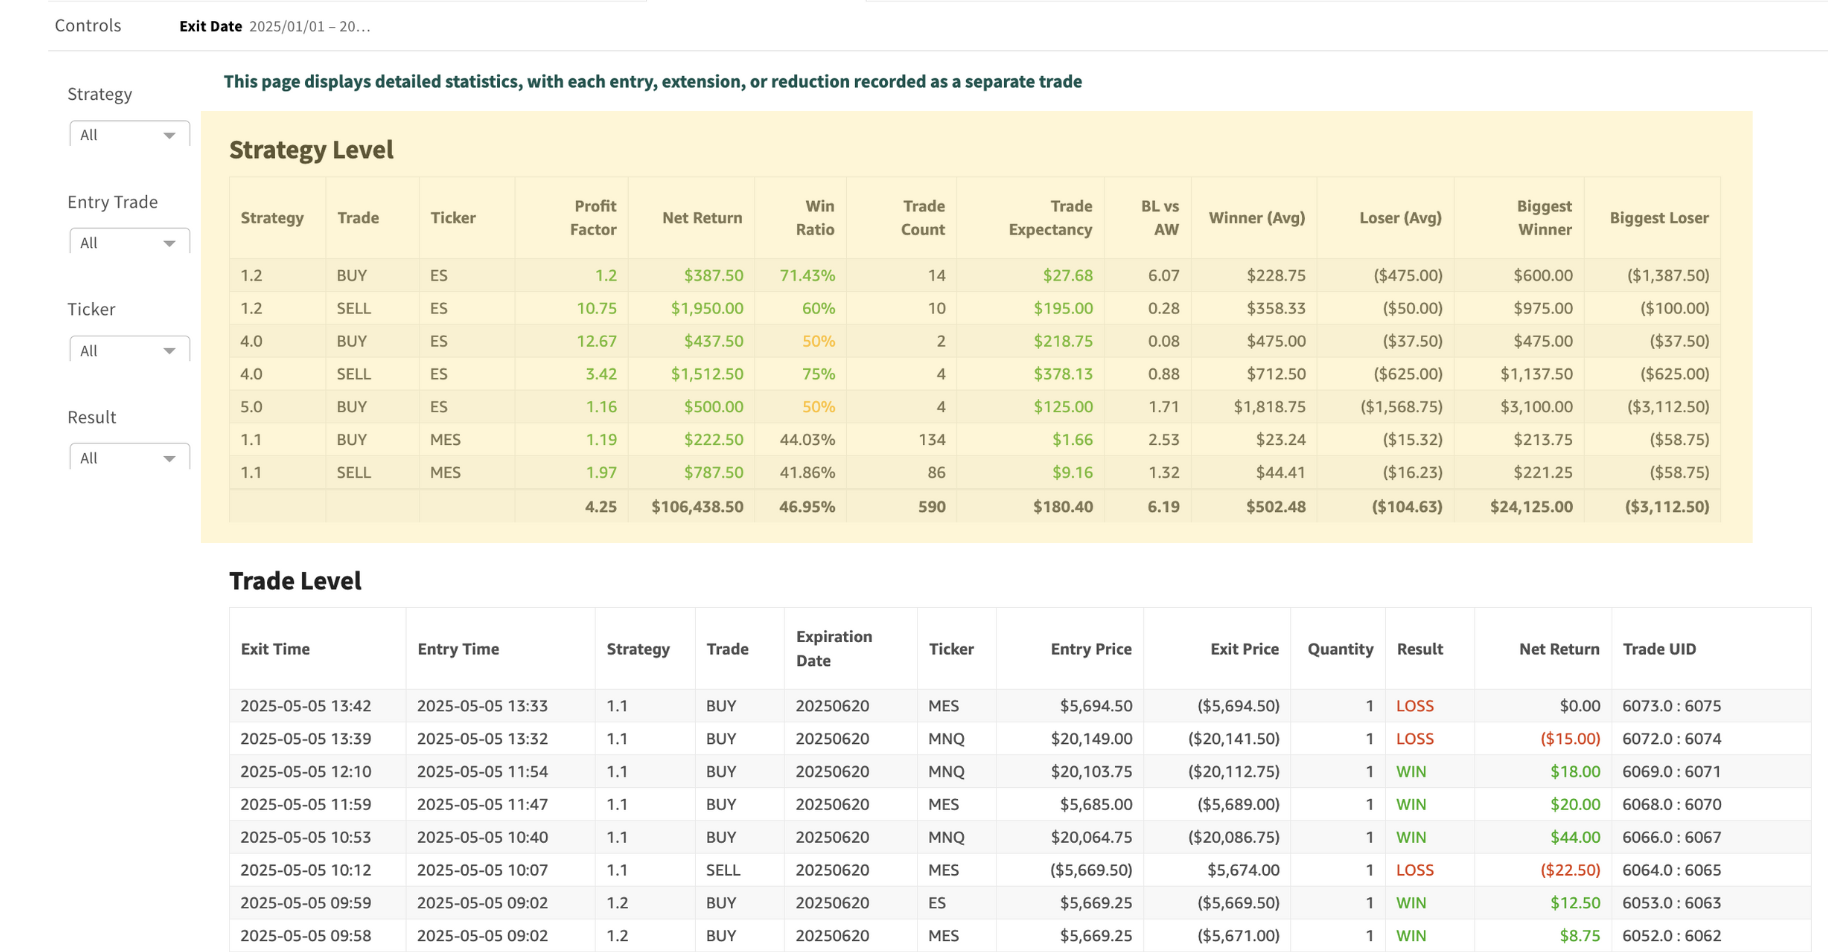
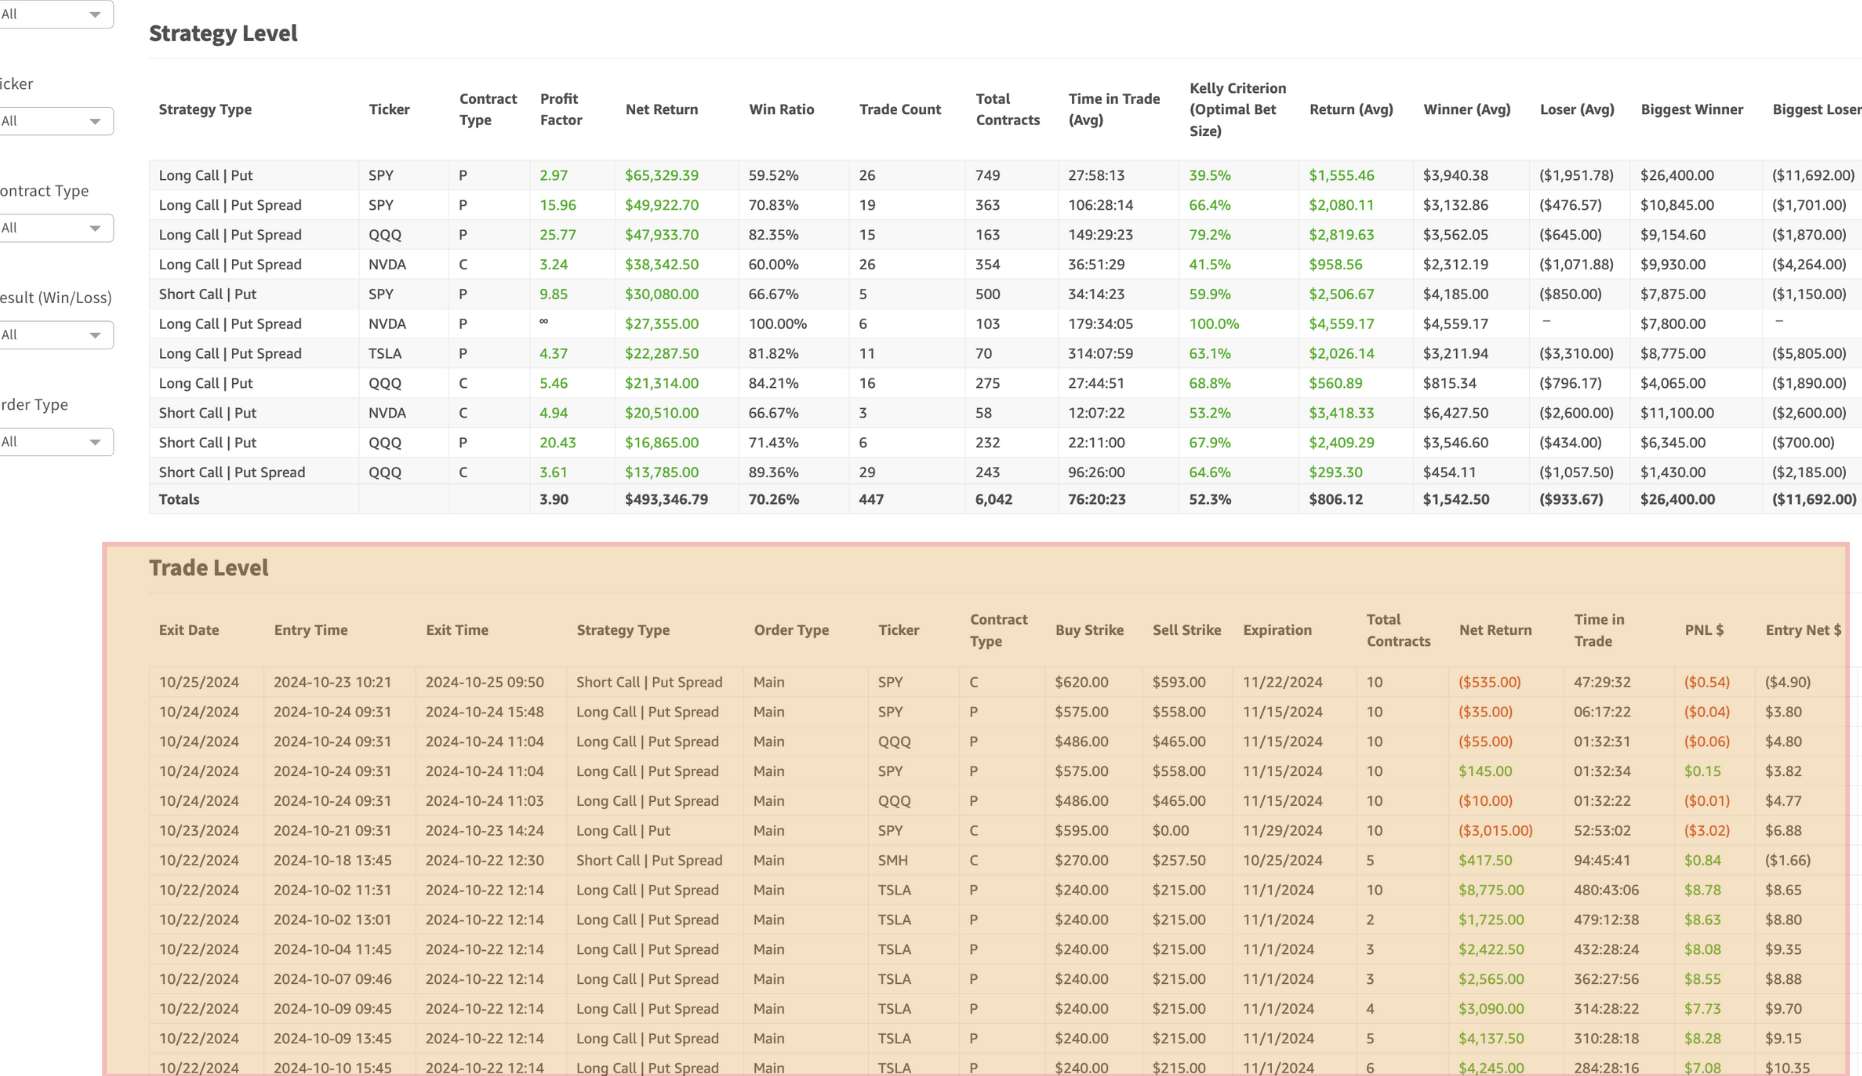
The Strategy Level gives you an overview of the total performance by strategy type and ticker, with KPIs like profit factor, net return, win ratio, and more.
The Strategy Level gives you an overview of the total performance by strategy type and ticker, with KPIs like profit factor, net return, win ratio, and more.
Strategy level KPIs/columns
Strategy Level Column | Definition |
Strategy | How 2MOON.AI refers to a strategy |
Trade | BUY or SELL |
Ticker | Symbol, such as SPY, QQQ, AAPL etc |
Profit Factor | The profit factor is a ratio that measures the profitability of a trading system by comparing the total profit to the total loss |
Net Return | total profit or loss from of a trade |
Win Ratio | Win ratio is the percentage of winning trades out of the total number of trades |
Trade Count (Entry) | Trade count by Entry. For example, if a single trade has 3 partial closes, it is counted as 1 trade by Entry |
Trade Count | Trade Count by Exit. For example,if a single trade has 3 partial closes, itis counted as 3 trade by Exit |
Total Contracts | total number of option contracts (calls and puts) traded within a specific period. |
Trade expectancy | How much money a strategy is expected to make on average |
BL vs AW | Biggest Loss / Average Win - lower the value the better |
Time in Trade | Time in hrs a position is held from entry to exit in a trade (includes all hrs, non-market and market hrs) |
Return (Avg) | the mean amount of profit or loss generated by an investment or trade over a specific period |
Winner (Avg) | refers to the mean profit earned from all winning trades within a given period |
Loser (Avg) | refers to the mean loss earned from all winning trades within a given period |
Biggest Winner | refers to the trade with the highest profit |
Biggest Loser | refers to the trade with the highest loss |
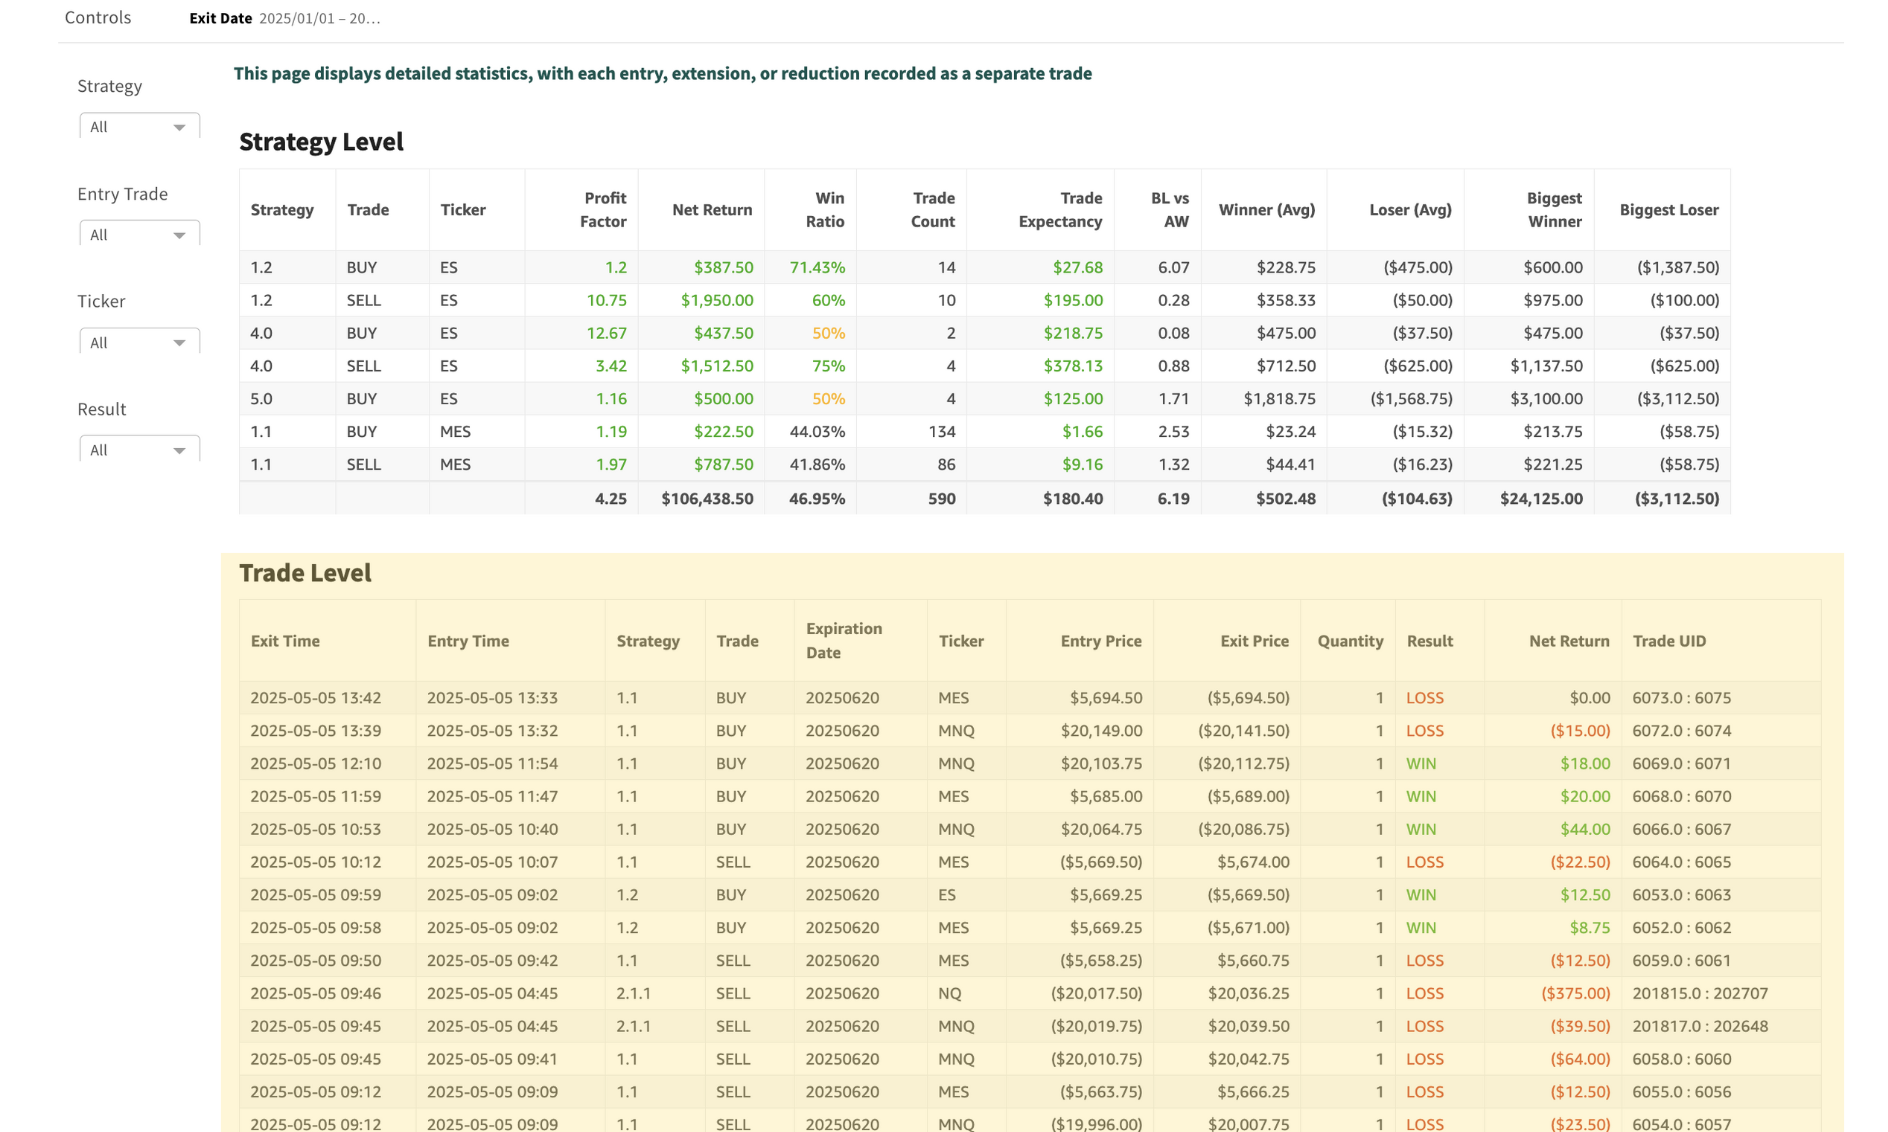
In the Trade Level, you’ll dive into detailed stats for every closed trade you received alerts for, complete with a variety of performance metrics
KPIs/columns in the Trade level and its definition
Strategy Level Columns | Definition |
Exit Date | refers to the date on which a trade is closed |
Entry Time | refers to the date & time on which a trade is opened |
Exit Time | refers to the date & time on which a trade is closed |
Strategy | How 2MOON.AI refers to a strategy |
Trade | BUY or SELL |
Ticker | Symbol, such as SPY, QQQ, AAPL etc |
Entry Price | total price paid to enter a trade |
Exit Price | total price paid to exit a trade |
Qty | Quantity of option contracts |
Result | WIN or LOSS |
Net Return | total profit or loss from of a trade |
Time in Trade | duration a position is held from entry to exit in a trade |
Trade UID | Unique trade ID |
Filters
Powerful 2MOON filters make analysis easier
Example: How to find Average time in trade for TSLA:
Filters on the left:
Strategy
Ticker
Entry Trade: BUY or SELL
Result (Win/Loss)
Filters on the top:
Exit Date filter
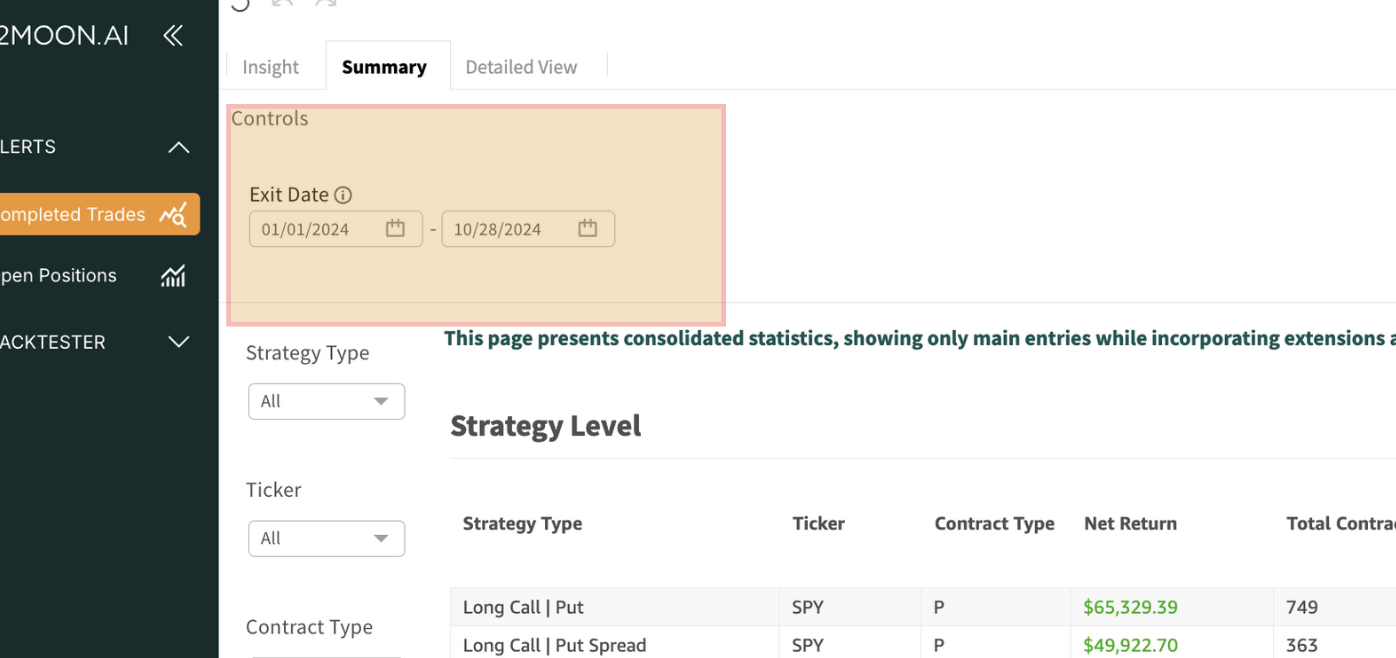
Reset filters
To reset filters click on the top left corner