How to use Strategy Analysis
To access, go to Backtester > Strategy Analysis Page or https://app.2moon.ai/dashboard/analyses
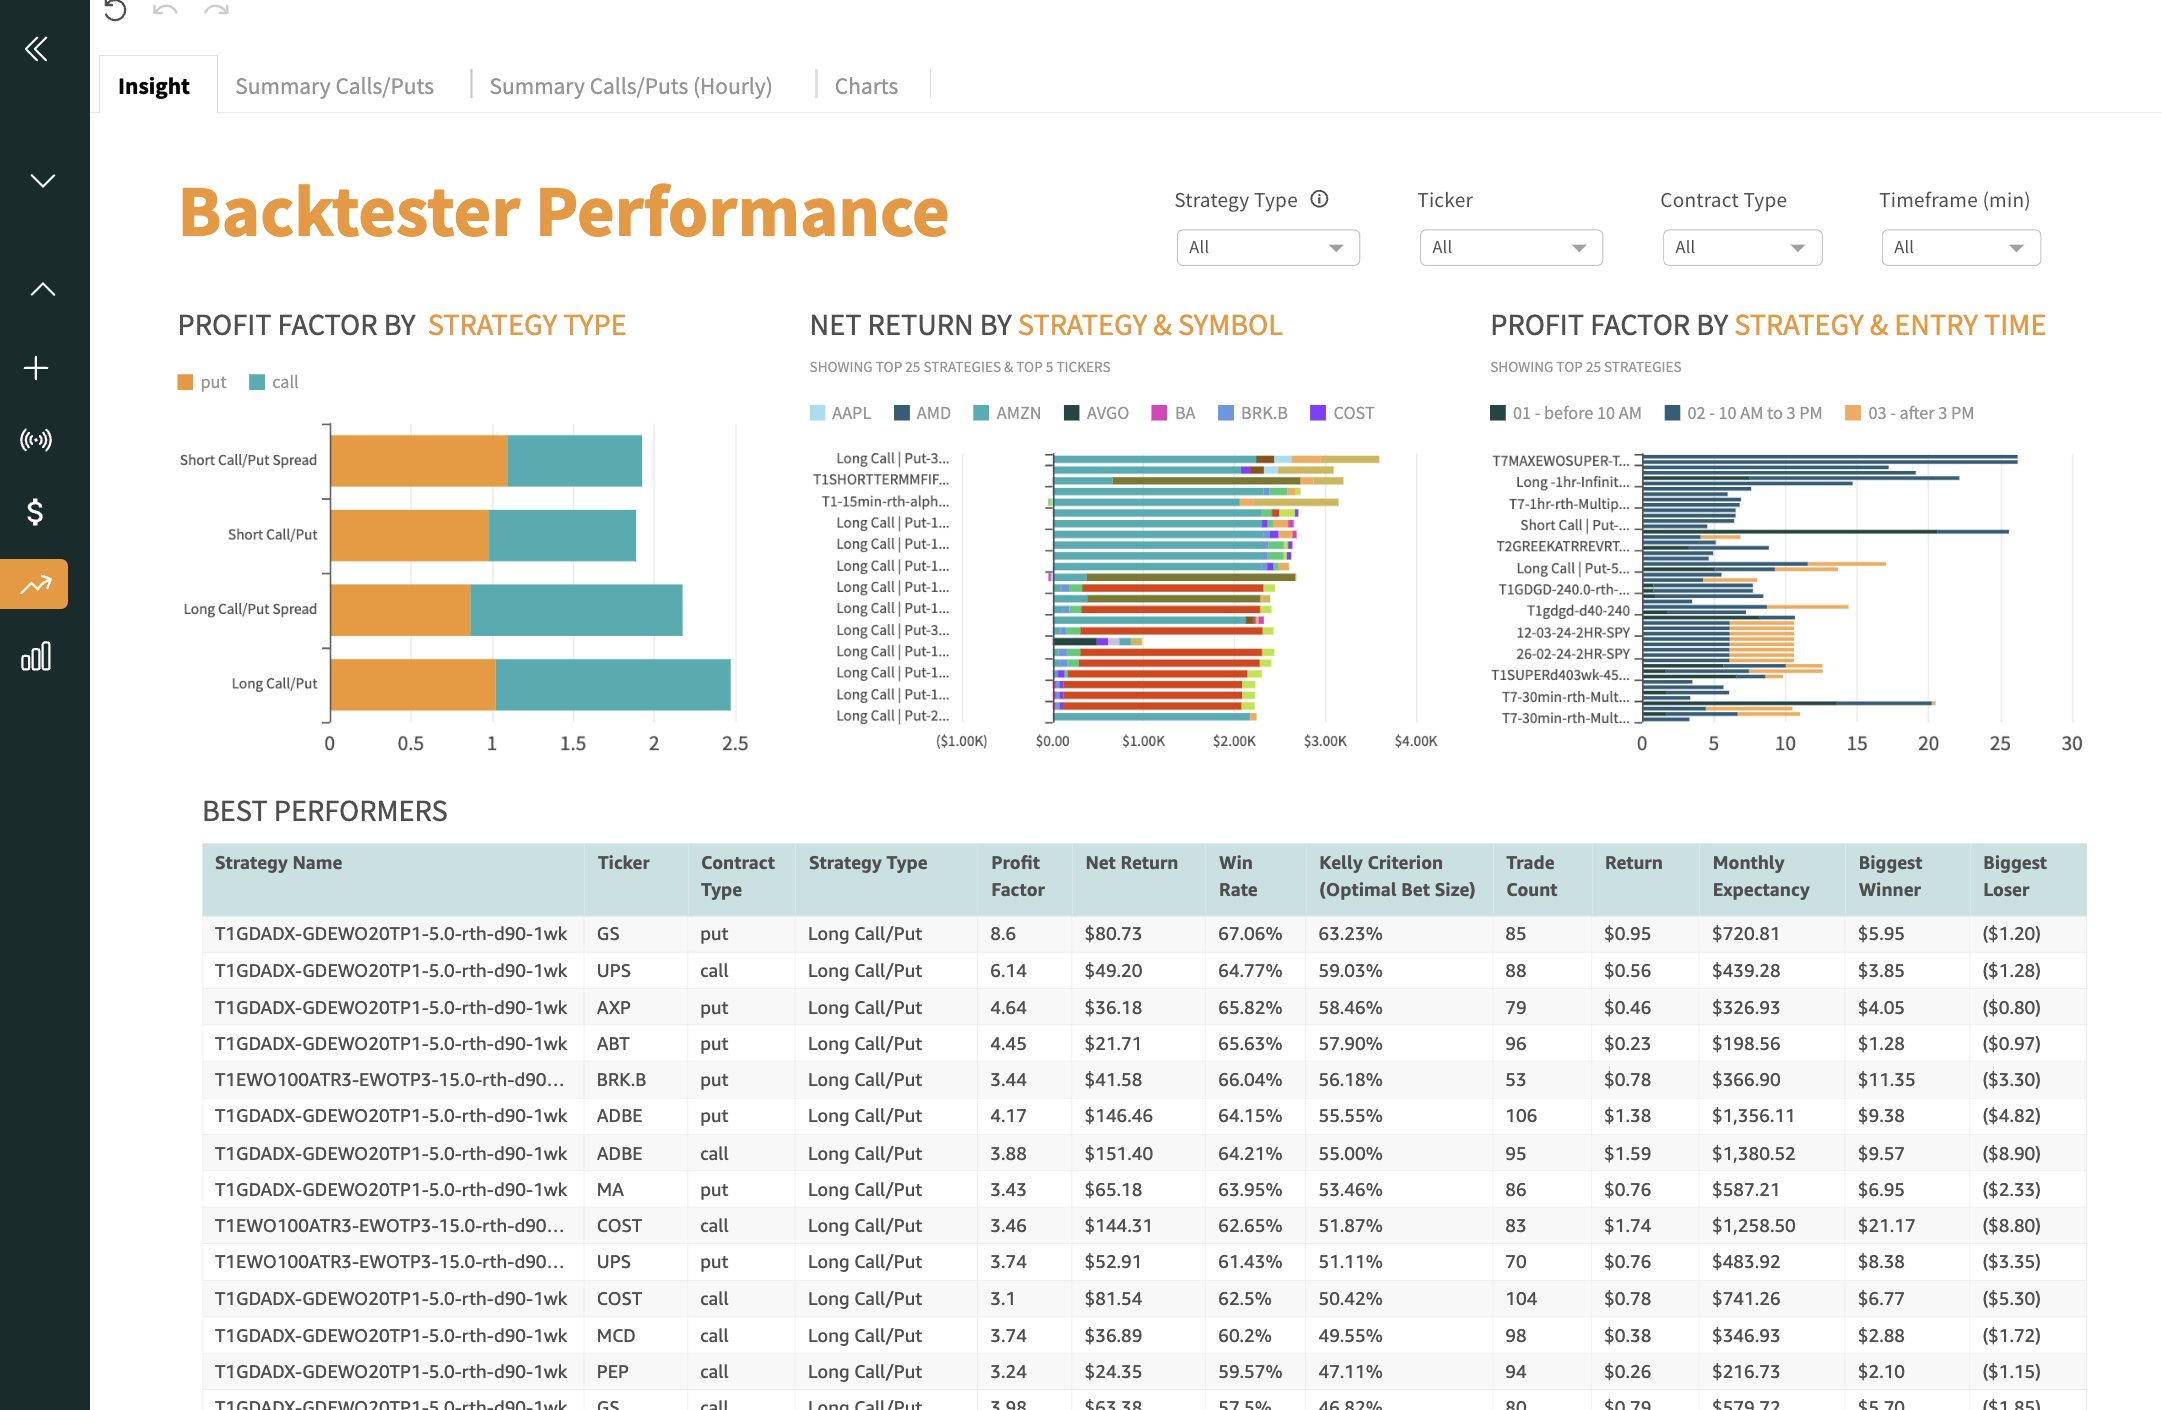
Insight Page
Insight page gives you a summary of your best and worst performers.
Summary Page
Summary Page gives you detailed information about trades you received alerts for and how they performed over time.
You will find two key sections: Strategy Level and Trade Level.
Strategy Level
The Strategy Level gives you an overview of the total performance by strategy type and ticker, with KPIs like profit factor, net return, win ratio, and more.
Bellow is the spreadsheet with KPIs/columns in the Strategy level and their definition
Strategy Level Column | Definition |
Trade Type | Type of trading method:
|
Strategy Name |
|
Ticker | Symbol, such as SPY, QQQ, AAPL etc |
Contract Type | C - Call, P - Put |
Profit Factor | The profit factor is a ratio that measures the profitability of a trading system by comparing the total profit to the total loss |
Net Return | total profit or loss from of a trade |
Win Ratio | Win ratio is the percentage of winning trades out of the total number of trades |
Trade Count | Trade Count by Exit. For example,if a single trade has 3 partial closes, itis counted as 3 trade by Exit |
Total Contracts | total number of option contracts (calls and puts) traded within a specific period. |
Time in Trade | duration a position is held from entry to exit in a trade |
Kelly Criterion | a formula used to determine the optimal size of a series of bets or trades to maximize long-term growth while minimizing risk |
Return (Avg) | the mean amount of profit or loss generated by an investment or trade over a specific period |
Winner (Avg) | refers to the mean profit earned from all winning trades within a given period |
Loser (Avg) | refers to the mean loss earned from all winning trades within a given period |
Biggest Winner | refers to the trade with the highest profit |
Biggest Loser | refers to the trade with the highest loss |
Total Wins | total number of profitable trades or bets made over a specific period |
Total Loss | total number of profitable trades or bets made over a specific period |
Monthly Expectancy | estimated average profit or loss an investment or strategy is projected to generate each month |
% Price Change |
|
Monthly Trades (Avg) | Average number of monthly expected trades |
Winning Trades | Total number of winning trades |
Losing Trades | Total number of losing trades |
Last Run | Date & time when you backtested your strategy |
Trade Level
In the Trade Level, you’ll dive into detailed stats for every closed trade you received alerts for, complete with a variety of performance metrics
Bellow is the spreadsheet with KPIs/columns in the Trade level and its definition
Strategy Level Info Columns | Definition |
Exit Date | refers to the date on which a trade is closed |
Entry Time | refers to the date & time on which a trade is opened |
Exit Time | refers to the date & time on which a trade is closed |
Timeframe | Strategy and Trade timeframe |
Strategy Type | Type of trading method:
|
Strategy name |
|
Ticker | Symbol, such as SPY, QQQ, AAPL etc |
Contract Type | C - Call, P - Put |
Buy Strike | refers to the specific price at which the buyer of an options contract can exercise the right to buy (call) or sell (put) the underlying asset |
Sell Strike | refers to the specific price at which the buyer of an options contract can exercise the right to sell (call) or sell (put) the underlying asset |
Expiration | refers to the date when an options contract or other derivative reaches the end of its validity, after which it can no longer be exercised |
Qty | Quantity of option contracts |
Net Return | total profit or loss from of a trade |
Time in Trade | duration a position is held from entry to exit in a trade |
PnL | represents the financial outcome of a trade per option contract |
Entry Net $ | total price paid to enter an options trade, including premiums |
Exit Net $ | total price paid to exit an options trade, including premiums |
Chart URL | Your strategy chart in TradingView |
Entry Underlying | refers to the price of the asset (such as a stock or commodity) at the time an options trade is initiated |
Exit Underlying | refers to the price of the asset at the time an options trade is closed |
Entry Buy Delta | Delta at a moment of trade entry |
Entry Sell Delta | Delta at a moment of trade close |
Chart Type | Extended Hours (ETH) |
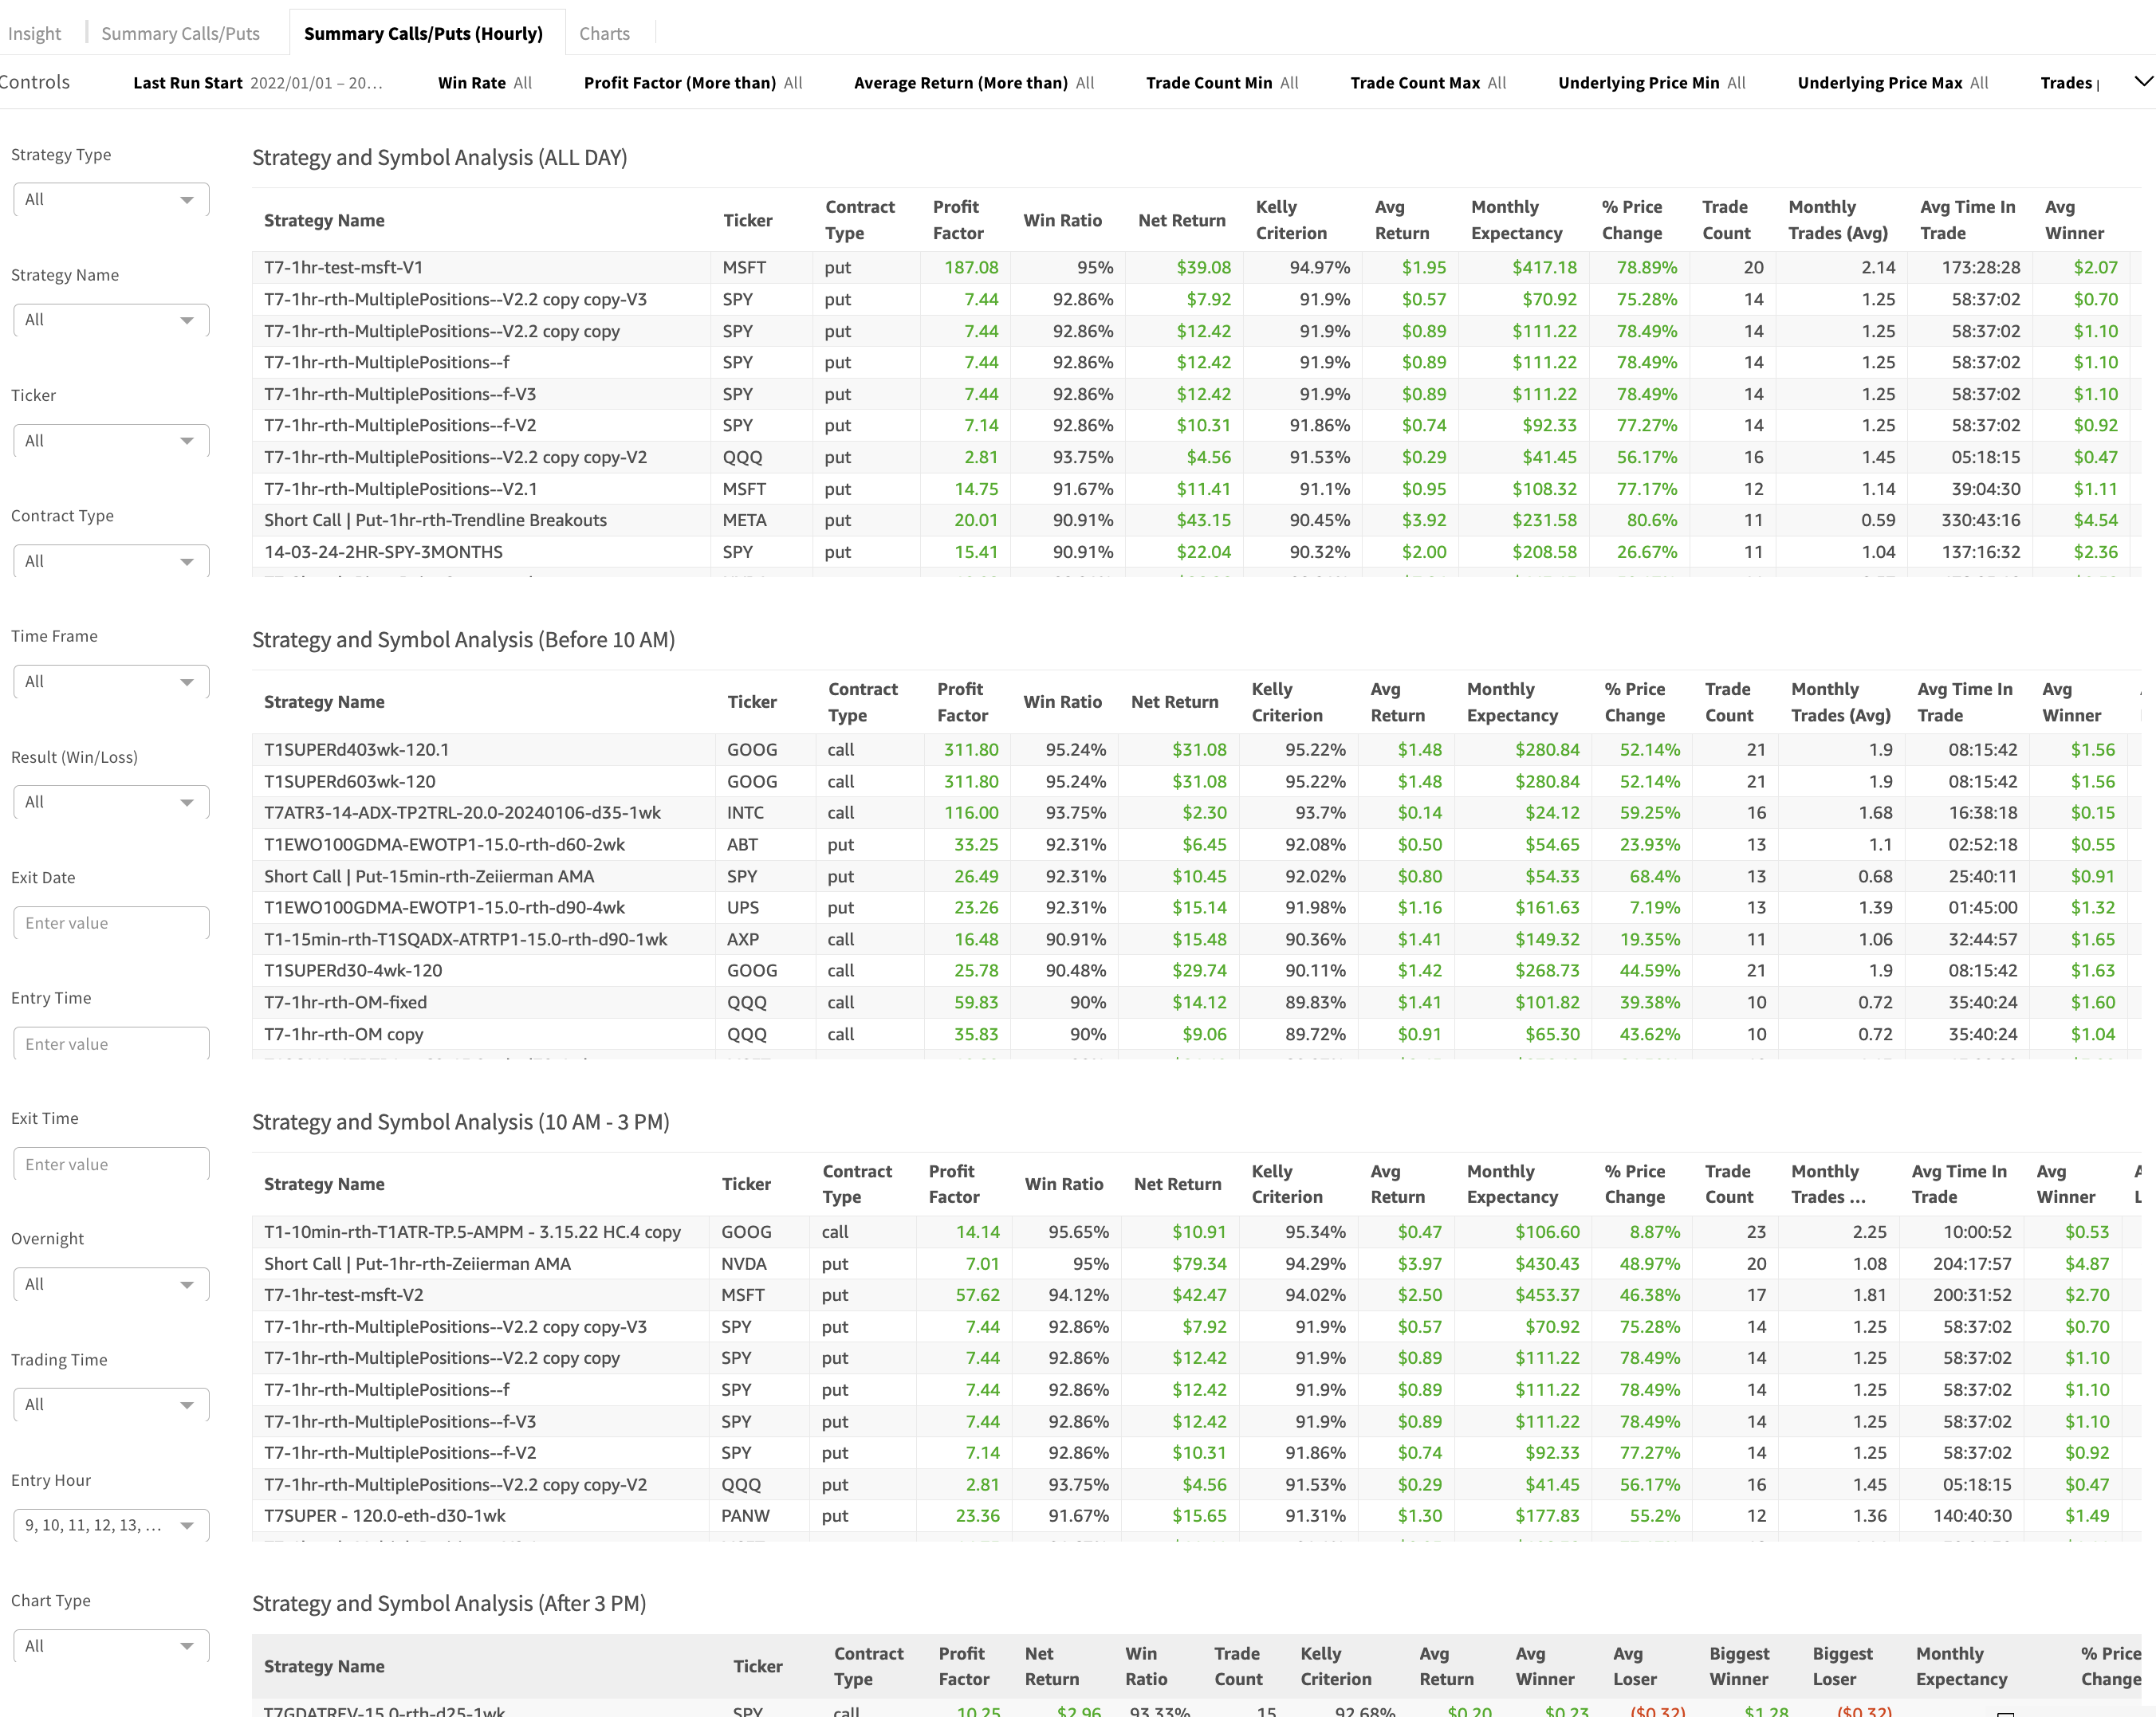
Summary Calls/Puts Hourly
Summary Calls/Puts Hourly Page breaks down on performance of your strategy depending on entry hour category:
9:30-10:00 AM,
10:00 - 15:00,
15:00-16:00
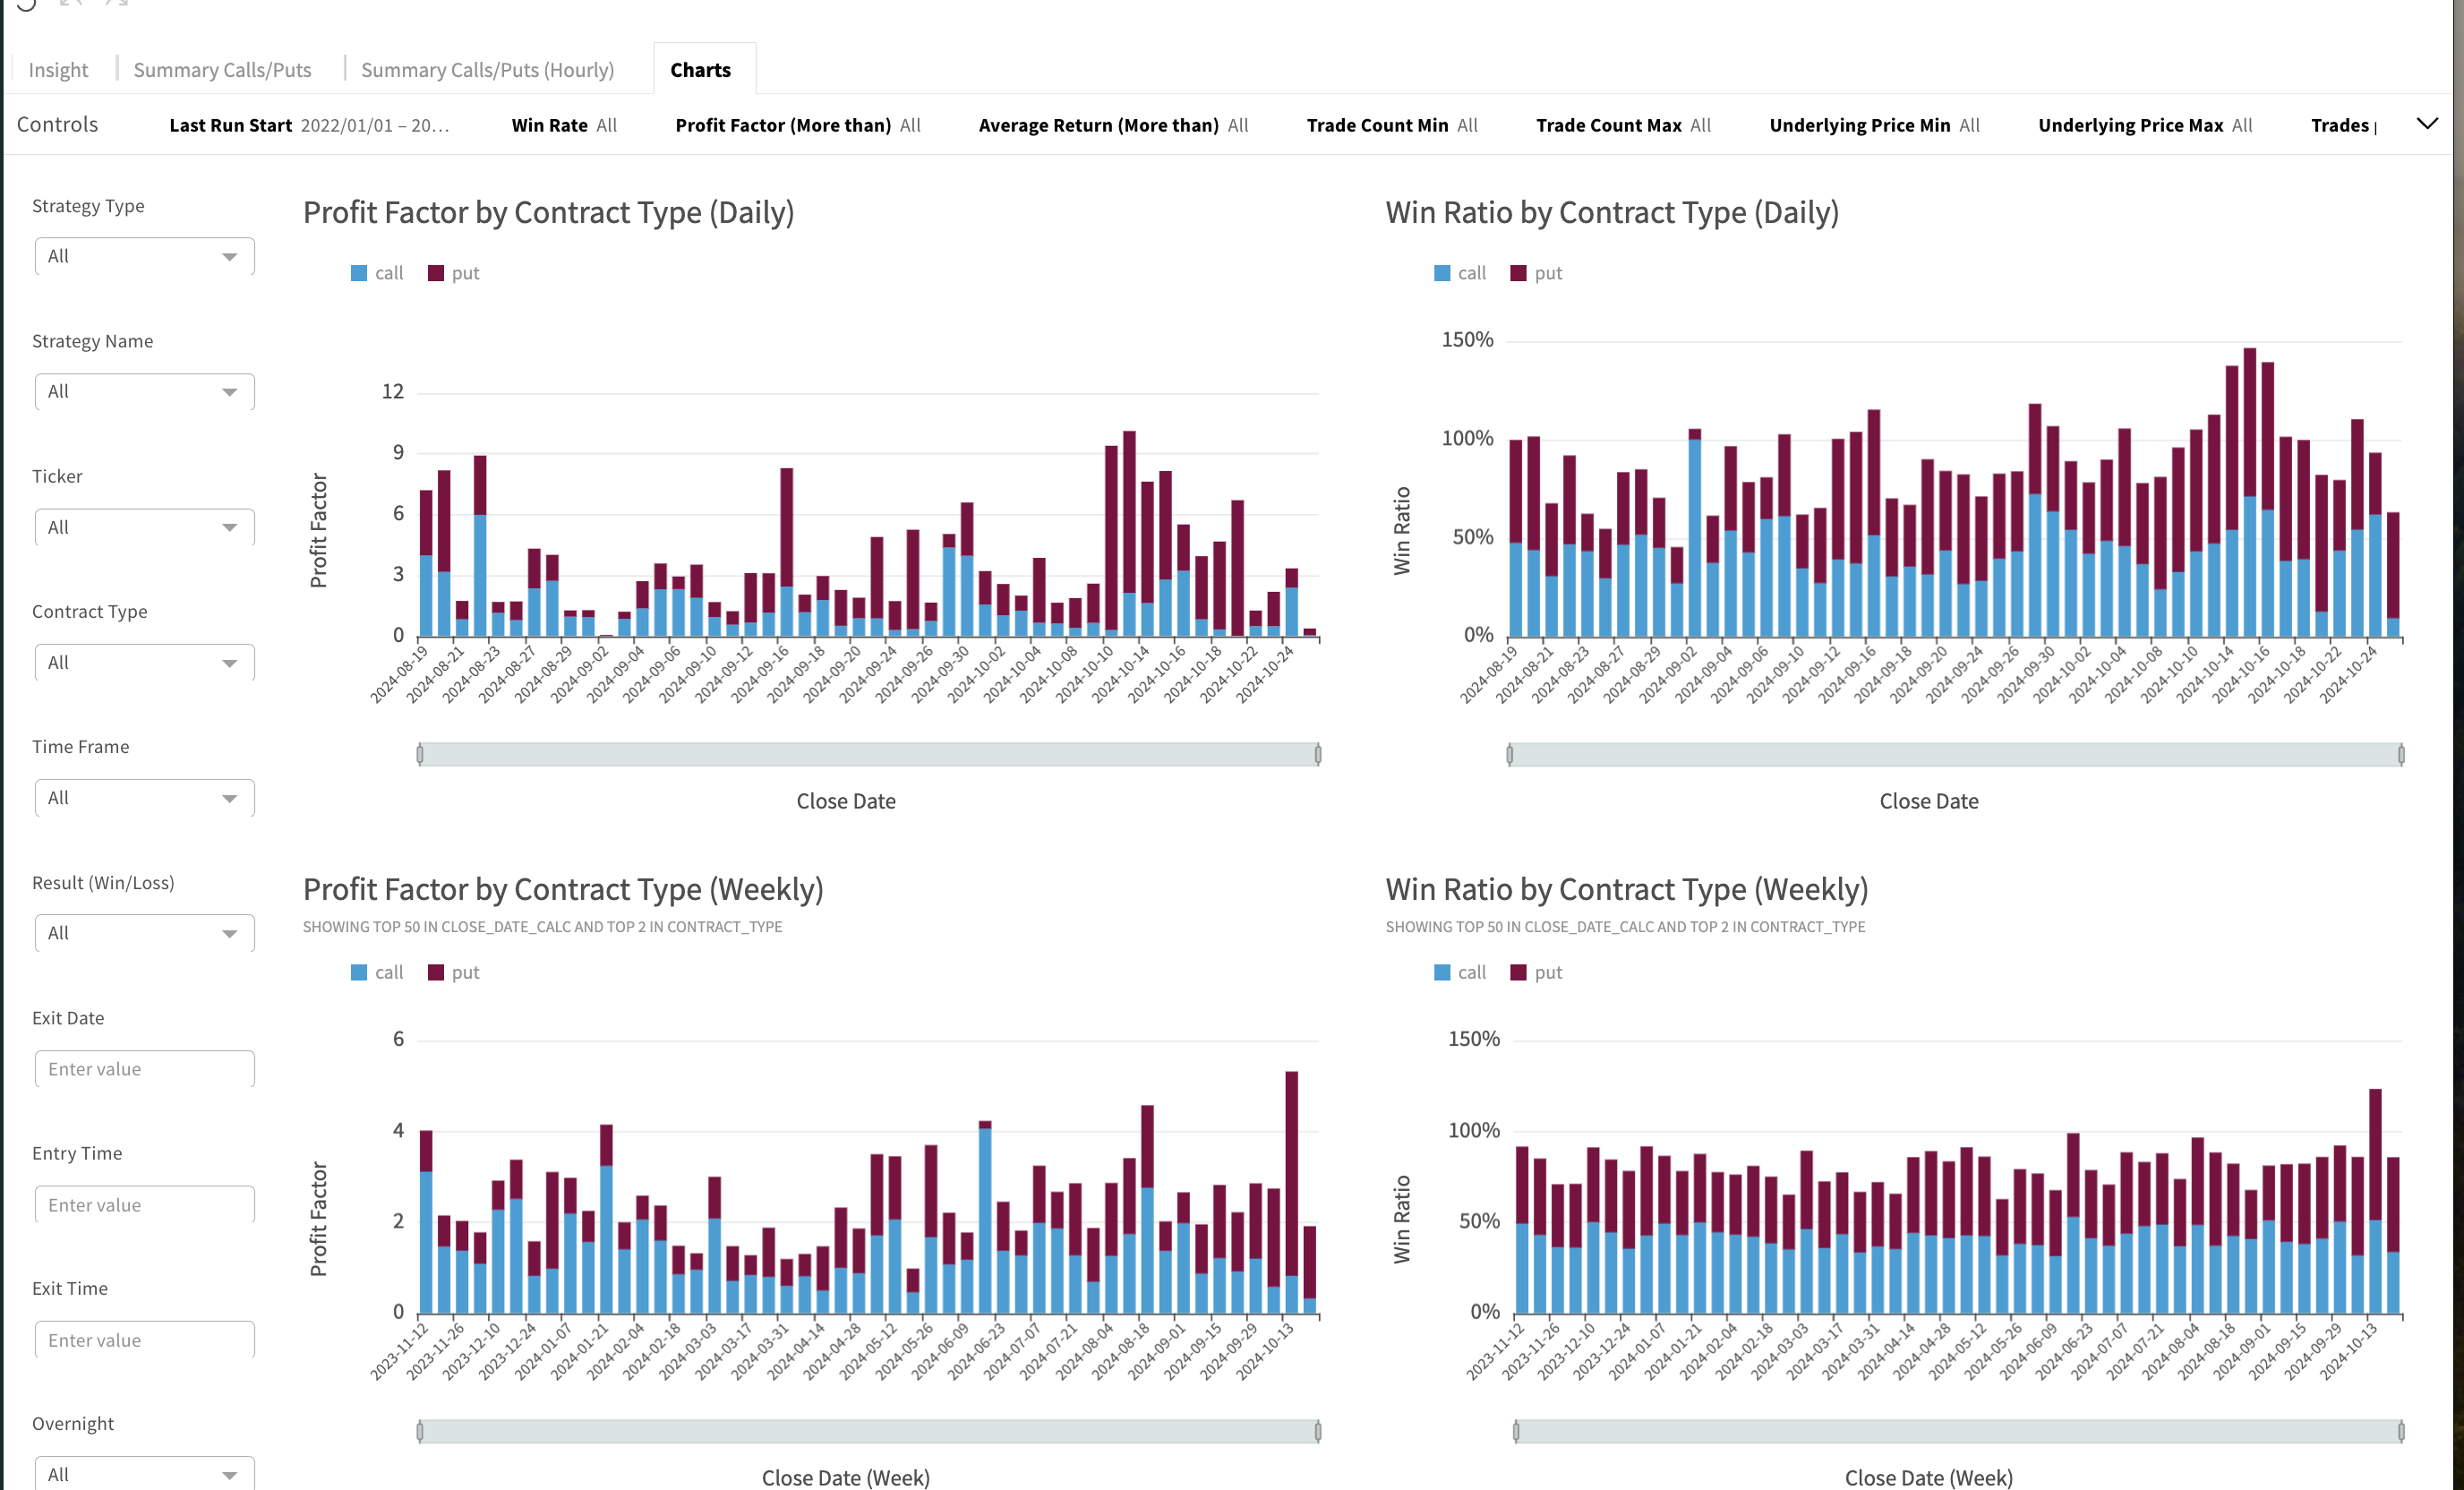
Charts
‘Charts’ page show performance of your strategies on daily, weekly and monthly basis