
Basic Indicator
2MOON Basic indicator: https://www.tradingview.com/script/GCVeuwVI-Basic-Indicator-v1-0-2MOON-AI/
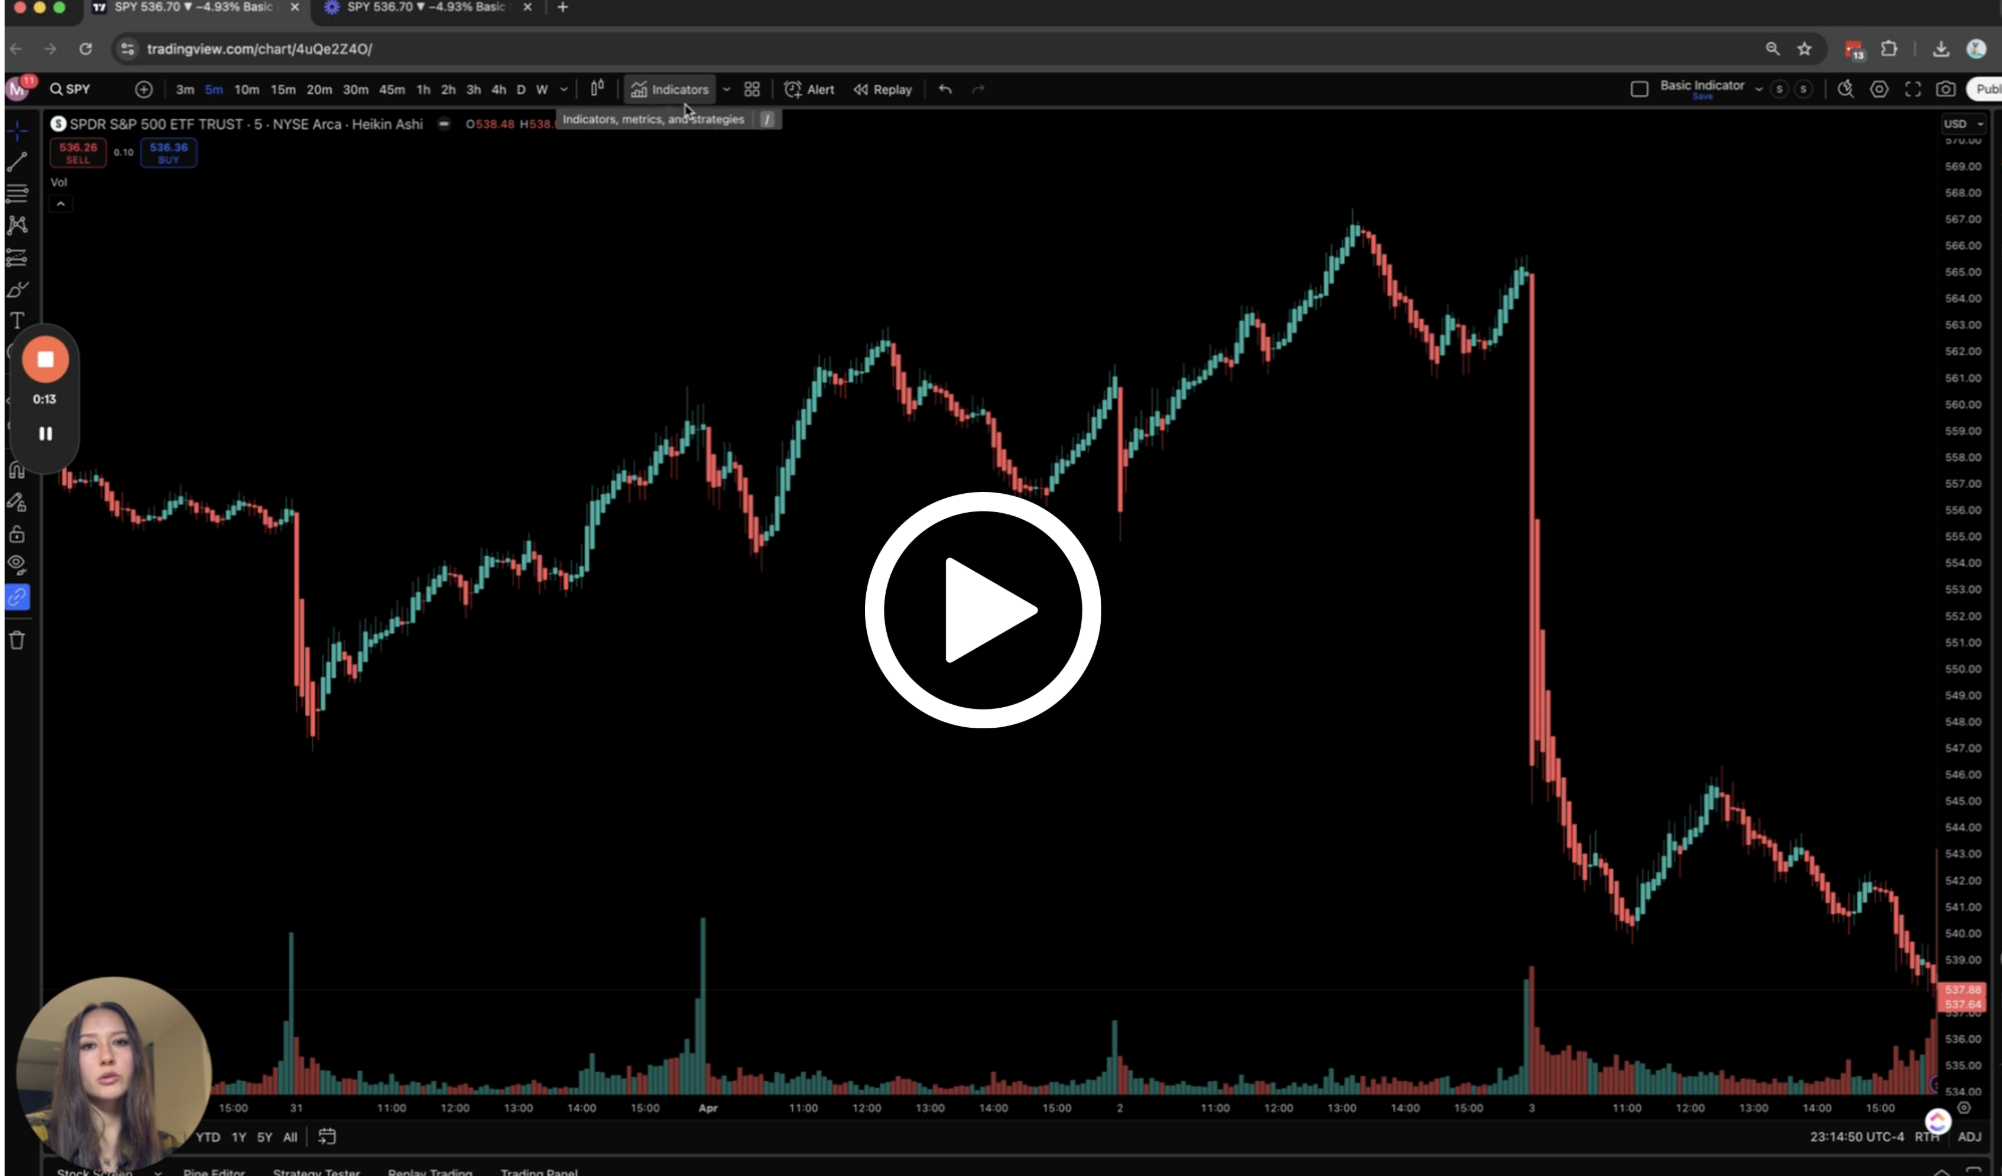
This video guide is submitted by a
How to find 2MOON Basic Indicator
Read how to connect your TradingView account here (for 2MOON Backtester)
If your TradingView username is already connected to 2MOON/ 2MOON has already granted you access to the indicator: read the instruction bellow:
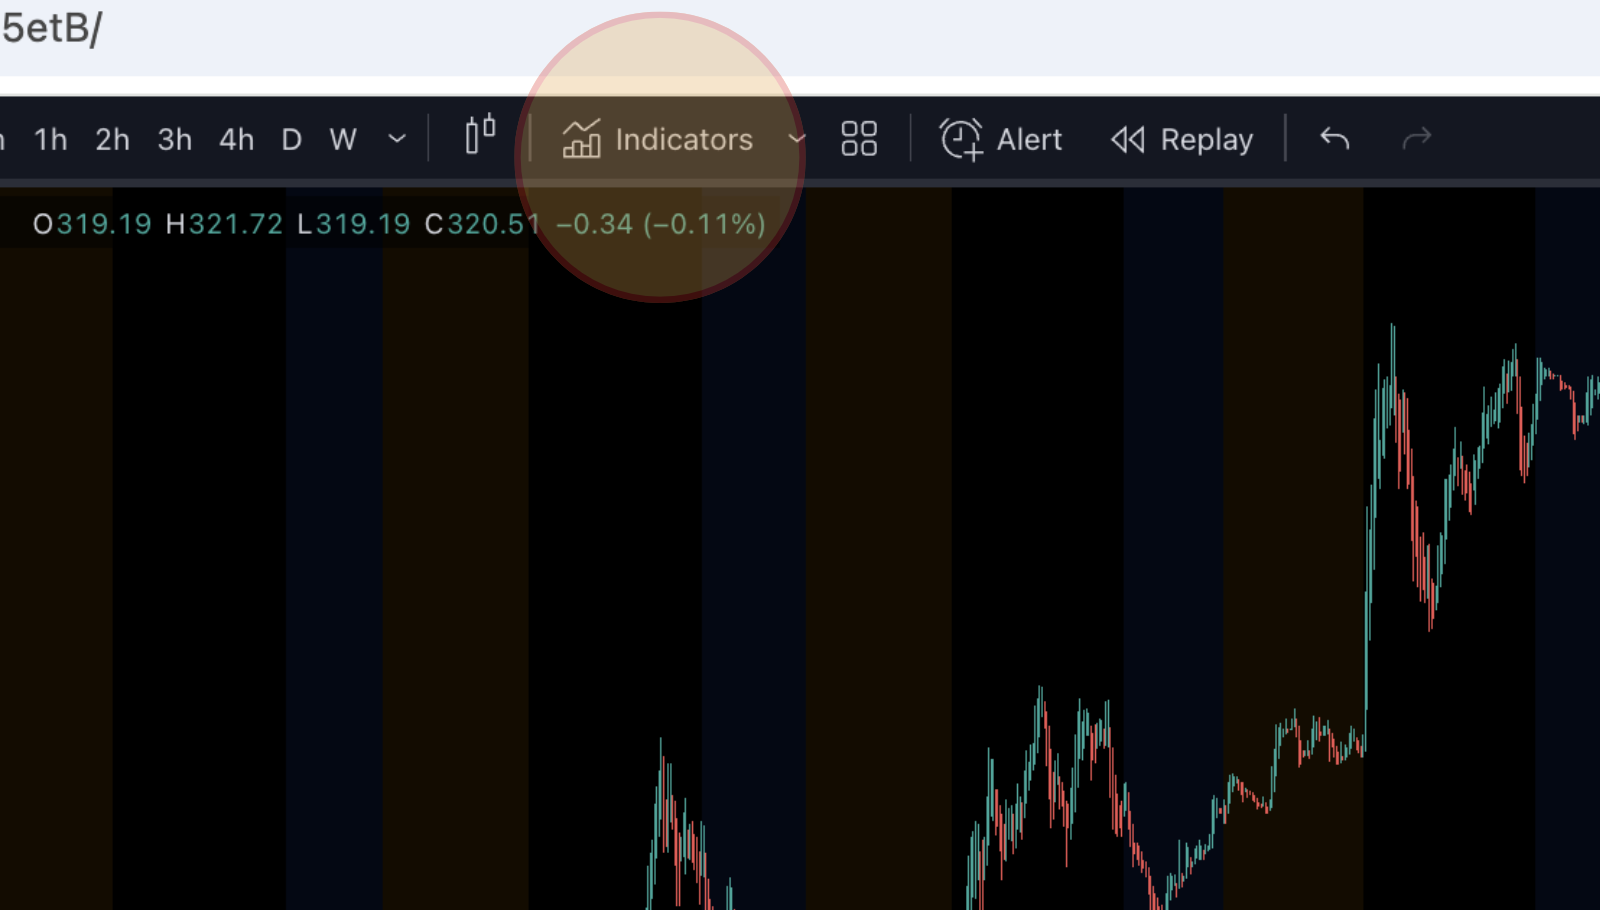
Click Indicators
 on the top panel
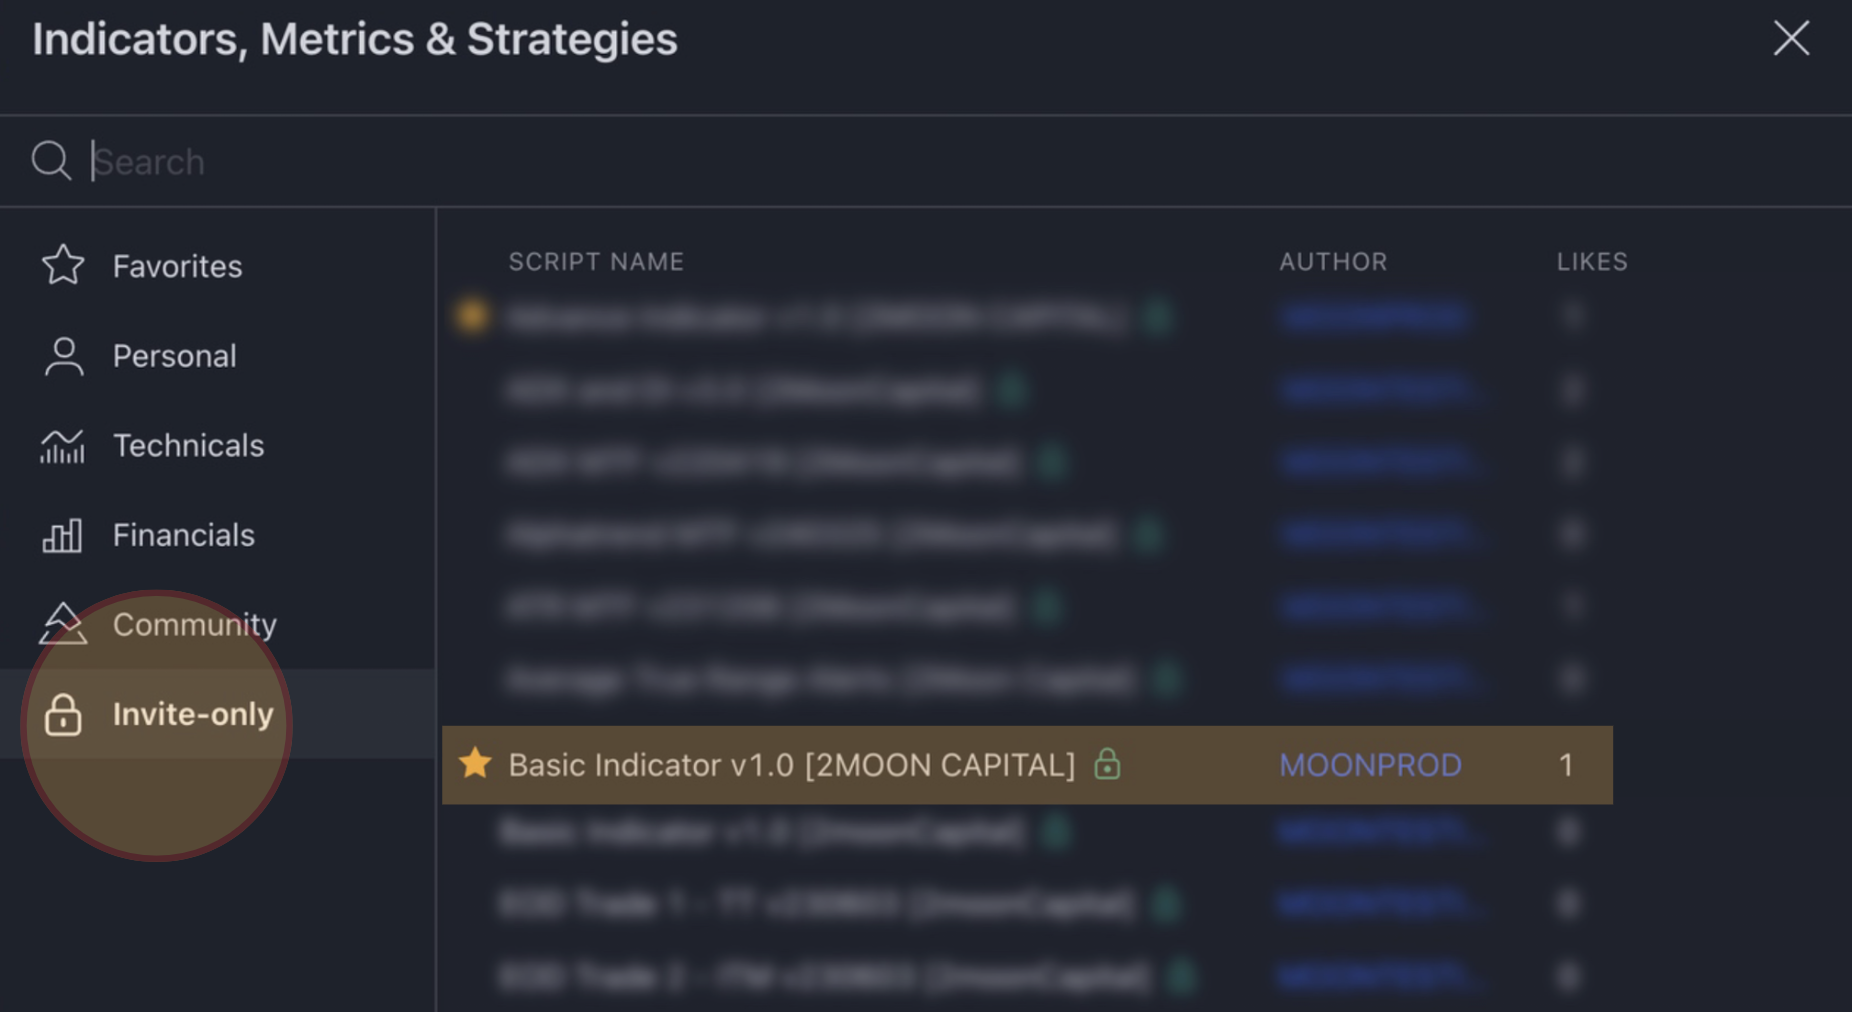
2. Click Invite only, then find Basic Indicator by 2MOON
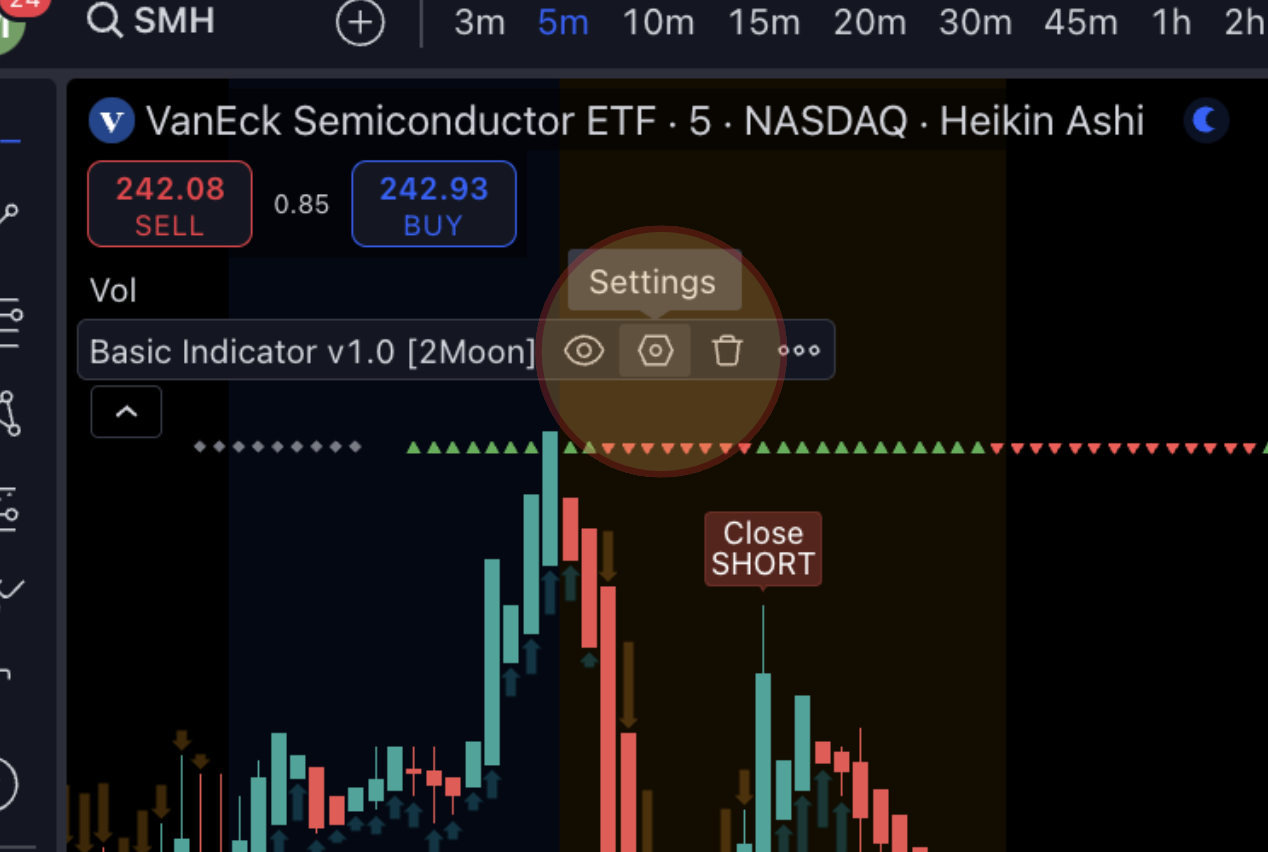
Configure 2MOON Basic Indicator
Click ![]() icon
icon
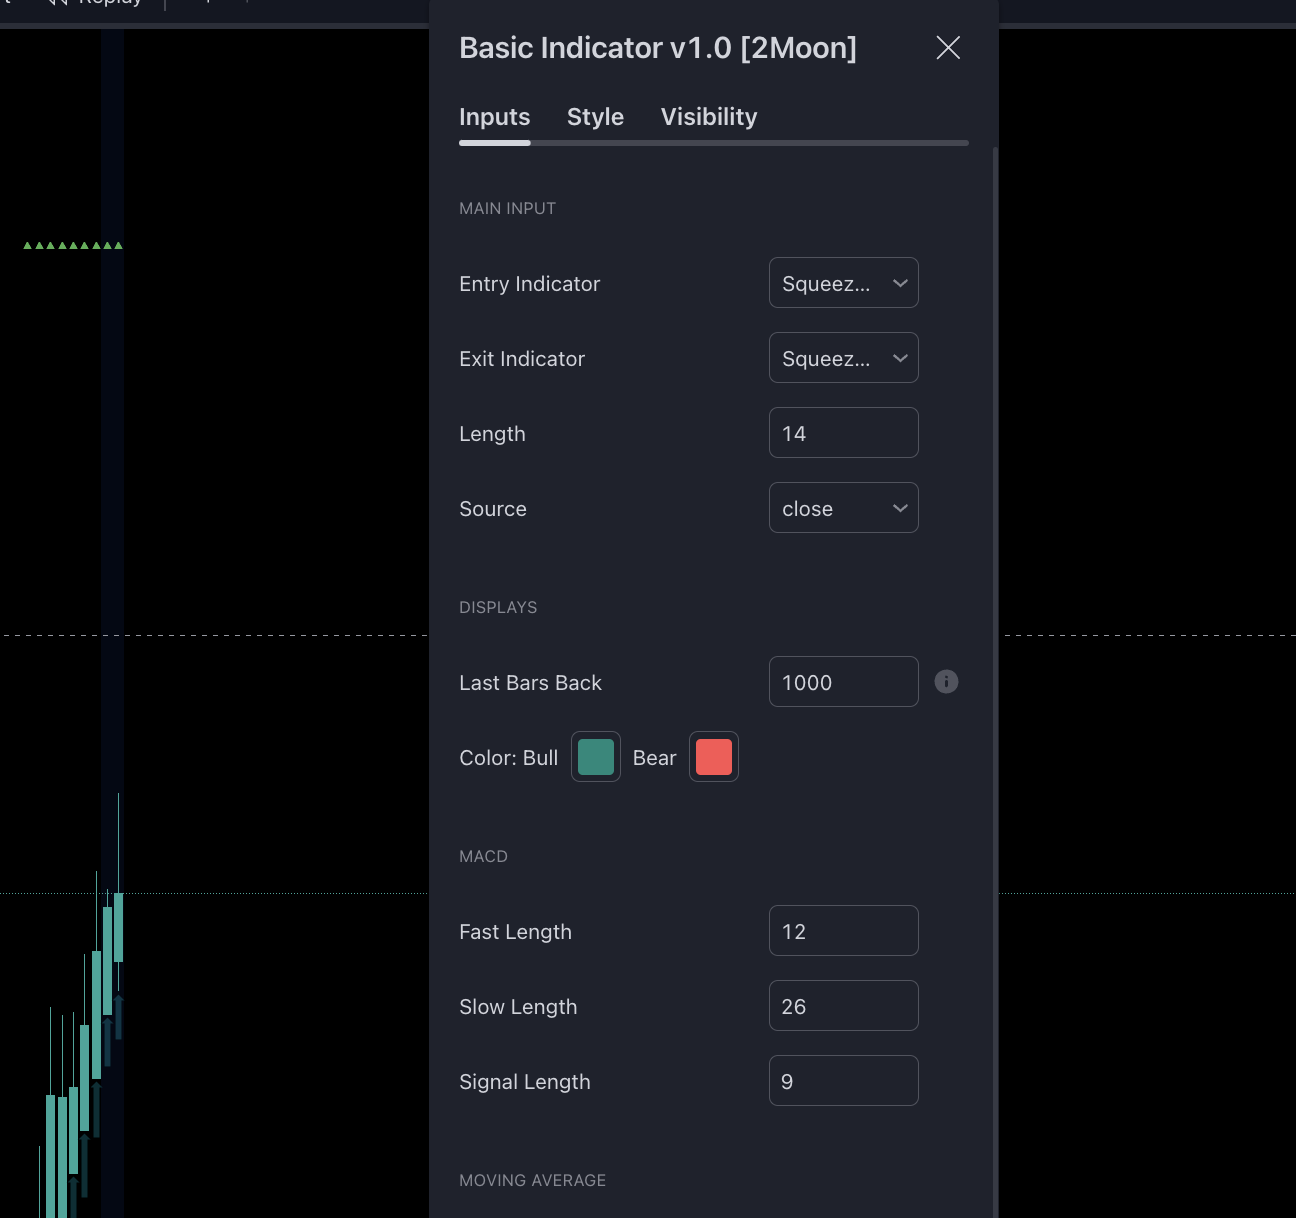
Basic Indicator v1.0 overview
Indicator Name: Basic Indicator v1.0 [2Moon]
Link: https://www.tradingview.com/script/GCVeuwVI-Basic-Indicator-v1-0-2MOON-AI/
Fields | Description | Available Options |
Entry Indicator | Trading indicator used to trigger buy or sell alerts |
|
Exit Indicator | Trading indicator used to trigger close long or close short alerts |
|
Length | Standard period used for indicator calculation. | This is set to 14 by default which means that it looks at the last 14 periods (whether days, weeks, etc.) of price data |
Last Bars Back | How many bars will be used by the script for calculation. | Set to 1000 by default. |
Color | Sets the colors of the alerts | Bull: Green |
Entry and Exit indicator description
Indicator Name | Description | Buy and Sell Logic |
Commodity Channel Index (CCI) | A technical analysis indicator used to evaluate and identify cyclical trends in a security's price, particularly in the commodities market. It helps traders determine overbought or oversold conditions in the market. |
|
Ichimoku Cloud | A comprehensive technical analysis tool that provides insights into support and resistance levels, momentum, and trend direction. It consists of multiple lines that help traders identify potential trend reversals and trading opportunities. |
|
Moving Average Convergence Divergence (MACD) | A popular trend-following momentum indicator that shows the relationship between two moving averages of a security's price. It is used to identify potential buy and sell signals and determine the overall trend direction. |
|
Money Flow Index (MFI) | A momentum indicator that measures the inflow and outflow of money into a security over a specific period. It is used to identify overbought or oversold conditions in the market and to confirm the strength of a trend. |
|
Momentum | A general term in technical analysis that refers to the rate of acceleration of a security's price movement. Momentum indicators help traders determine the strength or weakness of a trend and identify potential reversal points. |
|
Simple Moving Average (SMA) | A widely used technical analysis tool that helps smooth out price data by creating a constantly updated average price. It is used to identify trends and potential support and resistance levels in a security's price movement. |
|
Exponential moving average (EMA) | A widely used technical analysis tool that helps smooth out price data by creating a constantly updated average price. It is used to identify trends and potential support and resistance levels in a security's price movement. |
|
Moving average Cross | A trading strategy that involves the intersection of two moving averages. It is used to identify potential buy or sell signals and to confirm trend reversals. |
|
Parabolic SAR | A trend-following indicator that helps traders determine potential entry and exit points. It is used to set trailing stop-loss orders and to identify potential trend reversals in a security's price movement. |
|
Relative Strength Index (RSI) | A momentum oscillator that measures the speed and change of price movements. It is used to identify overbought or oversold conditions in the market and to assess the strength of a security's price movements. |
|
Stochastic (Stoch) | A momentum indicator that shows the location of a security's closing price relative to its price range over a specific period. It is used to identify overbought or oversold conditions and potential trend reversals. |
|
Squeeze Momentum | A general term in technical analysis that refers to the rate of acceleration of a security's price movement. Momentum indicators help traders determine the strength or weakness of a trend and identify potential reversal points. |
|